概要
小型電力量モニタを使用して分電盤の電力を計測します。
測定データはデータロガーへRS485(modbus)にて送信され、CSV形式で変換保存されます。
Raspberry piを用いて、このCSVファイルをブラウザ経由にて見える化します。
環境
・Raspberry pi 3 MODEL B@Raspbian Stretch
・Apache 2.4
・Python 3.5
参考
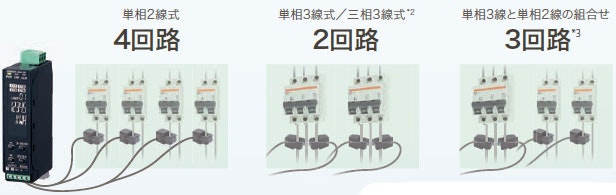
※オムロンHPより抜粋(http://www.fa.omron.co.jp/products/family/3413/)
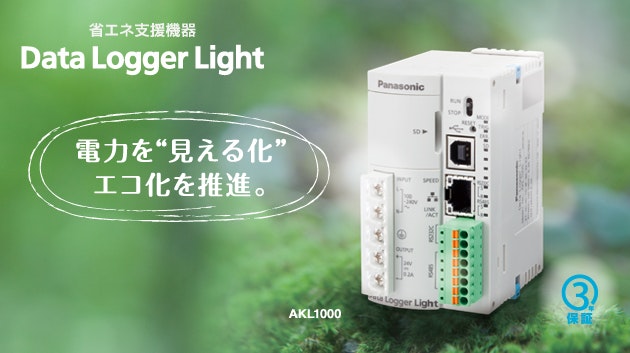
※パナソニックHPより抜粋(https://www3.panasonic.biz/ac/j/fasys/eco/sms/dll/index.jsp)
本文
Raspberry piにてWEBブラウザ(Apache)を立ち上げます。
cronにてPythonを定期的に実行
root@raspberrypi:/home/pi# crontab -e #cron呼び出し

* * * * * python3 /home/pi/web/cgi-bin/name.py #毎分ごとに自動実行
データロガーよりFTP経由にてpythonでCSVファイルをダウンロード
file1 = "filename.csv"
ftp = FTP("192.168.***.***","username",passwd="password")
ftp.cwd('CF/')
ftp.dir(".")
with open("out.csv", "wb") as f:
    ftp.retrbinary("RETR %s" %file1, f.write)
ftp.quit()
pandasで読み込みと一覧表をHTML形式で出力します
data = pd.read_csv("out.csv",  engine='python',encoding="Shift_JIS", na_values=['-','A','W','kWh'])
df = pd.DataFrame(data)
df.to_html('/home/pi/web/out.html')
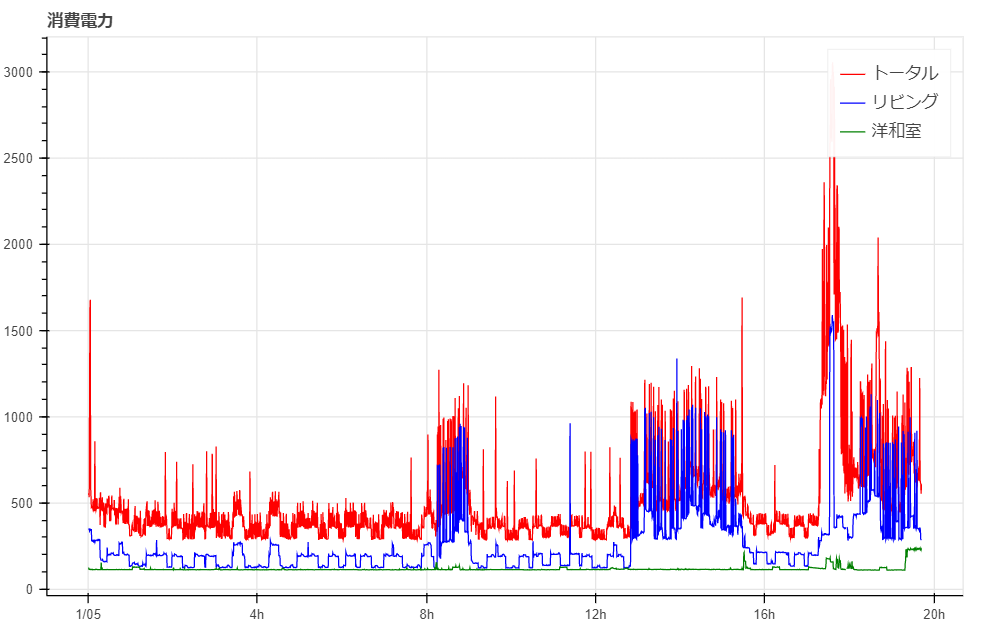
解析、グラフ化をおこない、HTML形式にて出力します
POW1 = df["POW1"]
POW2 = df["POW2"]
POW3 = df["POW3"]
time = pd.to_datetime(df["Time"])
df.index = time

pow = figure(plot_width=800, plot_height=500,title="消費電力",x_axis_type="datetime", tools="pan,wheel_zoom,box_zoom,reset,save")


pow.line(df.index, POW1, legend="トータル", color="red")
pow.line(df.index, POW2, legend="リビング", color="blue")
pow.line(df.index, POW3, legend="洋和室", color="green")

plots = pow

# ==== create HTML components ====
script, div = components(plots)

# ==== Output HTML ====
filename = "/home/pi/web/graph.html"

template = Template('''<!DOCTYPE html>
<html lang="en">
    <head>
        <meta charset="utf-8">
        <title>Power Graph</title>
        {{ js_resources }}
        {{ css_resources }}
        {{ script }}
        <style>
            .embed-wrapper {
                width: 95%;
                height: 600px;
                margin: auto;
            }
        </style>
    </head>
    <body>
        <div class="embed-wrapper">
            {{ div }}
        </div>
    </body>
</html>
''')

js_resources = INLINE.render_js()
css_resources = INLINE.render_css()
html = template.render(js_resources=js_resources,
                       css_resources=css_resources,
                       script=script,
                       div=div)

with io.open(filename, mode='w', encoding='utf-8') as f:
    f.write(html)

view(filename)
FTPはftplibライブラリ
CSVの読み込み、解析はpandasライブラリ
グラフ化とHTML化はBokehライブラリを使用しています。
from ftplib import FTP
import pandas as pd
from bokeh.embed import components
from bokeh.models import Range1d
from bokeh.plotting import figure, output_file, show, ColumnDataSource
from bokeh.resources import INLINE
from bokeh.util.browser import view
from bokeh.palettes import d3
from bokeh.layouts import gridplot
from bokeh.io import output_file, show
from bokeh.models import PrintfTickFormatter, HoverTool
当初matplotライブラリで考えていましたが、ブラウザに出力する方法が
画像データであったのでやむなく却下。
Jupyter Notebookなんかのスタンドアロン環境であれば使用可能です。
出力図
ブラウザから見ると拡大縮小など動きます。
今後
・日付をまたいだCSVファイルの合体など見やすくしたい。
・測定からデータの保存まで既製品なのでRaspberry piに任せると安くあがるかも?