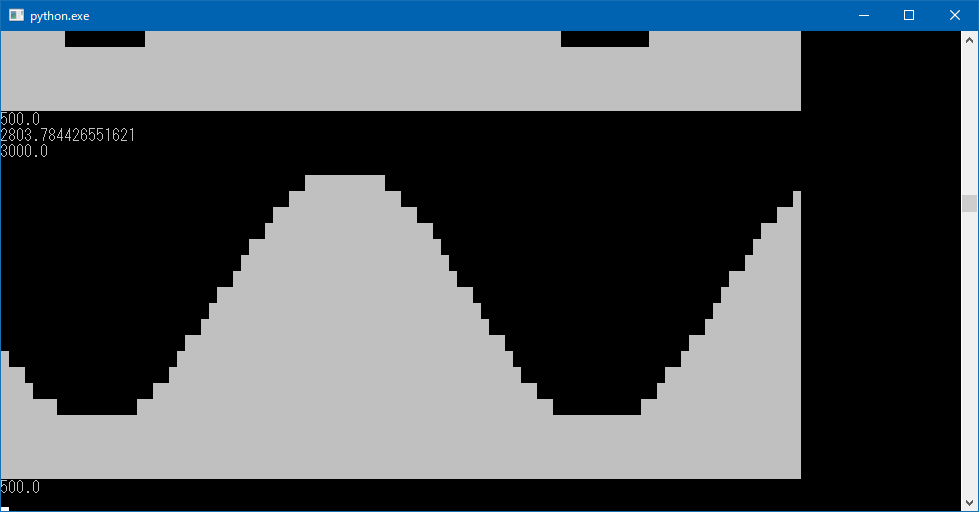
分解能は荒いし、車輪の再発明感がすごいが、Windowsでも動く
# -- coding: utf-8 --
import math
import time

ymax = 20

max_points = 100
max_value = 3000.0
min_value = 500.0

def TextChartShow(pdat,max_value,min_value,ymax):
    print(max_value)
    for y in range(ymax):
        for xd in pdat:
            if(xd < ymax-y):
                if(y==ymax-1):
                    print("_",end='')
                else:
                    print(" ",end='')
            else:
                print("█",end='')
        print("")
    print(min_value)

def TextChartMake(plots,max_value,min_value,ymax):
    pdat = []

    for point in plots:
        pdat.append(int(((point-min_value)*(ymax/(max_value-min_value)))))
    return pdat;

def TextChartPlotsAdd(point_in,plots,max_points):
    plots.append(point_in)
    if(len(plots) > max_points):
        plots.pop(0)
    return plots


##リアルタイムに正弦波を書くサンプル
plots = [0]
i=0
while True:
    i=i+1
    point_in = math.sin(i*0.1)*1000+2000
    print(point_in)
    plots = TextChartPlotsAdd(point_in,plots,max_points)
    pdat = TextChartMake(plots,max_value,min_value,ymax)
    TextChartShow(pdat,max_value,min_value,ymax)
    time.sleep(0.1)