準備:
+ Python
+ Pandas
+ Numpy
import pandas as pd
import numpy as np
参照:
+ Pandas Cheat Sheet
データを作成、読み込み、書き込み
DataFrame作成
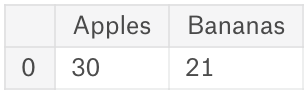
# create a dataframe
df = pd.DataFrame({
    'Apples': [30],
    'Bananas': [21]
})
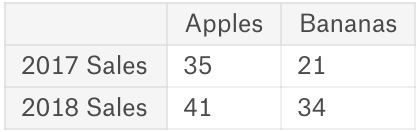
# create a dataframe with index
df = pd.DataFrame({
    'Apples': [35,41],
    'Bananas': [21, 34]
}, index=['2017 Sales', '2018 Sales'])
Series作成
以下のようSeriesを作成
Flour     4 cups
Milk       1 cup
Eggs     2 large
Spam       1 can
Name: Dinner, dtype: object
sr = pd.Series(
    ['4 cups', '1 cup', '2 large', '1 can'],
    index=['Flour', 'Milk', 'Eggs', 'Spam']
)
Csvファイル読み込み
# Read csv file with first column is index
df = pd.read_csv('../path/to/file.csv', index_col=0)
Xslファイル読み込み
# Read excel file from sheet 1
df = pd.read_excel('../path/to/excel.xsl', 'sheet 1')
Sqliteファイル読み込み
# using sqlite3 lib
import sqlite3
# need initial connection for sqlite
cnx = sqlite3.connect('../path/to/sqlfile.sqlite')
# query from db
df = pd.read_sql_query('SELECT * FROM tables_name', cnx)
データ書き込み
# save to csv
df.to_csv('../path/to/new/file.csv')

# save to excel
df.to_excel('../path/to/file.xsl')
インデックス、選択、アサイン
コラムのデータ選択
# select column col1 from dataframe
df['col1']

# select first row of column col1
df['col1'][0]

# select first 10 rows from column col1
df['col1'][0:10]
# or using loc
df.loc[0:9, 'col1']
# or using iloc
df.iloc[0:10, index_of_col1]

# select col1 where col1 = xxx
df[df['col1'] == 'xxx']['col1']

# select col1 where col1 = xxx and col2 === yyy
# or |
# and &
df[(df['col1'] == 'xxx') & (df['col2'] === 'yyy')]['col1']
ローのデータ選択
# select first row of dataframe
# using loc
df.loc[0]
# using iloc
df.iloc[0]

# select rows with index
# for example select row with index 1, 2, 3, 6
df.iloc[[1,2,3,6]]
# or using loc
df.loc[[1,2,3,6]]

# select only columns col1, col2
df.loc[[1, 2, 3, 6], ['col1', 'col2']]
合計、マップデータ
中央値(median)
# median of column col1 in dataframe
df['col1'].median()
ユニークな値(unique)
# find all unique data of column col1
df['col1'].unique()
よく出る値(value_counts)
# what values is appear more offen in column col1
df['col1'].value_counts()
コラムとしてメッソド適用(apply)
# add 1 for each cell in column col1
def addOne(source):
  return source + 1

df['col1'].apply(addOne)
# or using lambda
df['col1'].apply(lambda x: x + 1)
グループ、ソート
コラムを元にグループ
# show number of records group by col1
df.groudby(['col1']).size()

# group by col1, show median of col2 for each group
df.groupby(['col1']).col2.median()

# group by col1, show median, sum of col2 for each group
df.groupby(['col1']).col2.agg['median', 'sum']

# multiple index and sorting desc
df.groupby(['col1', 'col2']).col3.agg['min', 'max'].sort_values(by=['min', 'max'], ascending=False)
データタイプとミスデータ
データタイプチェック
# check col1's datatype
df.col1.dtypes
df['col1'].dtypes

# check multiples cols
df[['col1', 'col2']].dtypes
データタイプ更新
# change col1 datatype to integer
df.col1 = df.col1.astype(int)
コラムのミスデータ検索
# find missing values via column col1 and its orcurrs time
df.col1.fillna('N/A').value_counts()

# check is there missing value via column col1
df.col1.isnull().value_counts()

# replace value ? to N/A via col1
df.col1.replace("?", "N/A")