AWSの無料枠を使って特定キーワードを含むtweetの数を時系列に分析する環境を作ってみたので、備忘録のためにその時の作業をまとめました。この記事の分析を目指しましたが、t2.microではメモリ不足に陥ってしまい、結局Logstashの部分はPythonのtweepyでやることにしました。
やりたいこと
- AWSの無料枠を活用してTwitterの分析を実施する
- Logstashで特定のキーワードを含むツイートを取得
- Logstashがツイートの情報をElasticsearchに格納
- Kibanaを使って可視化
この記事の内容
- AWSインスタンスの立ち上げと基本設定
- Elasticsearchのインストールと初期設定
- Kibanaのインストールと初期設定
- Logstashのインストール
これだけで結構なボリュームになったのでTwitterの分析は別記事でまとめます。
AWS EC2インスタンスの立ち上げ
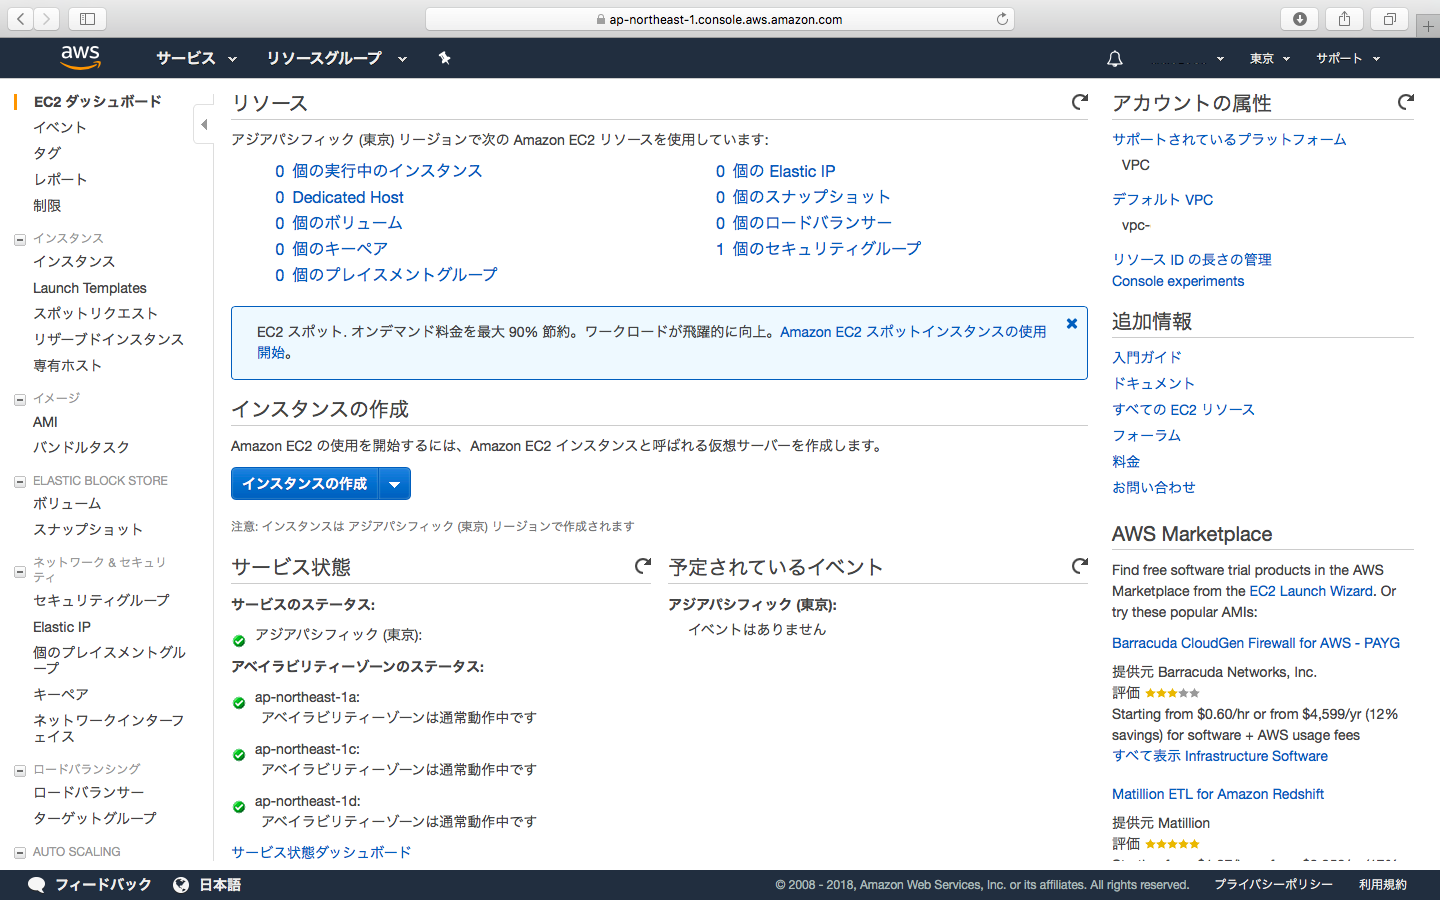
まずはAWSでEC2インスタンスを立ち上げます。
インスタンスの作成
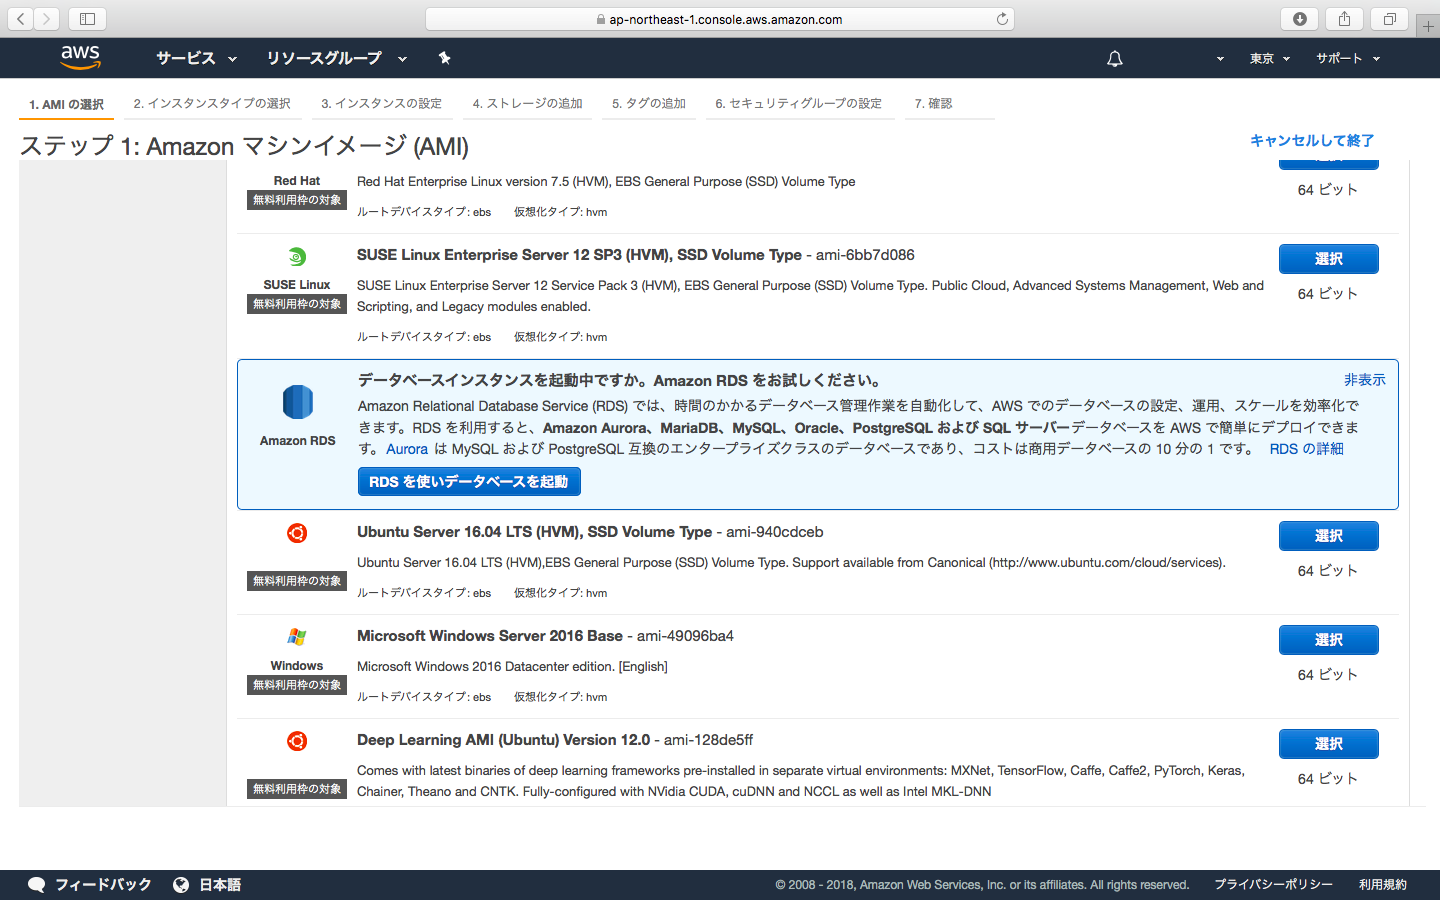
AMI(Amazon Machine Image)の選択で無料利用枠の対象であるUbuntuを選択
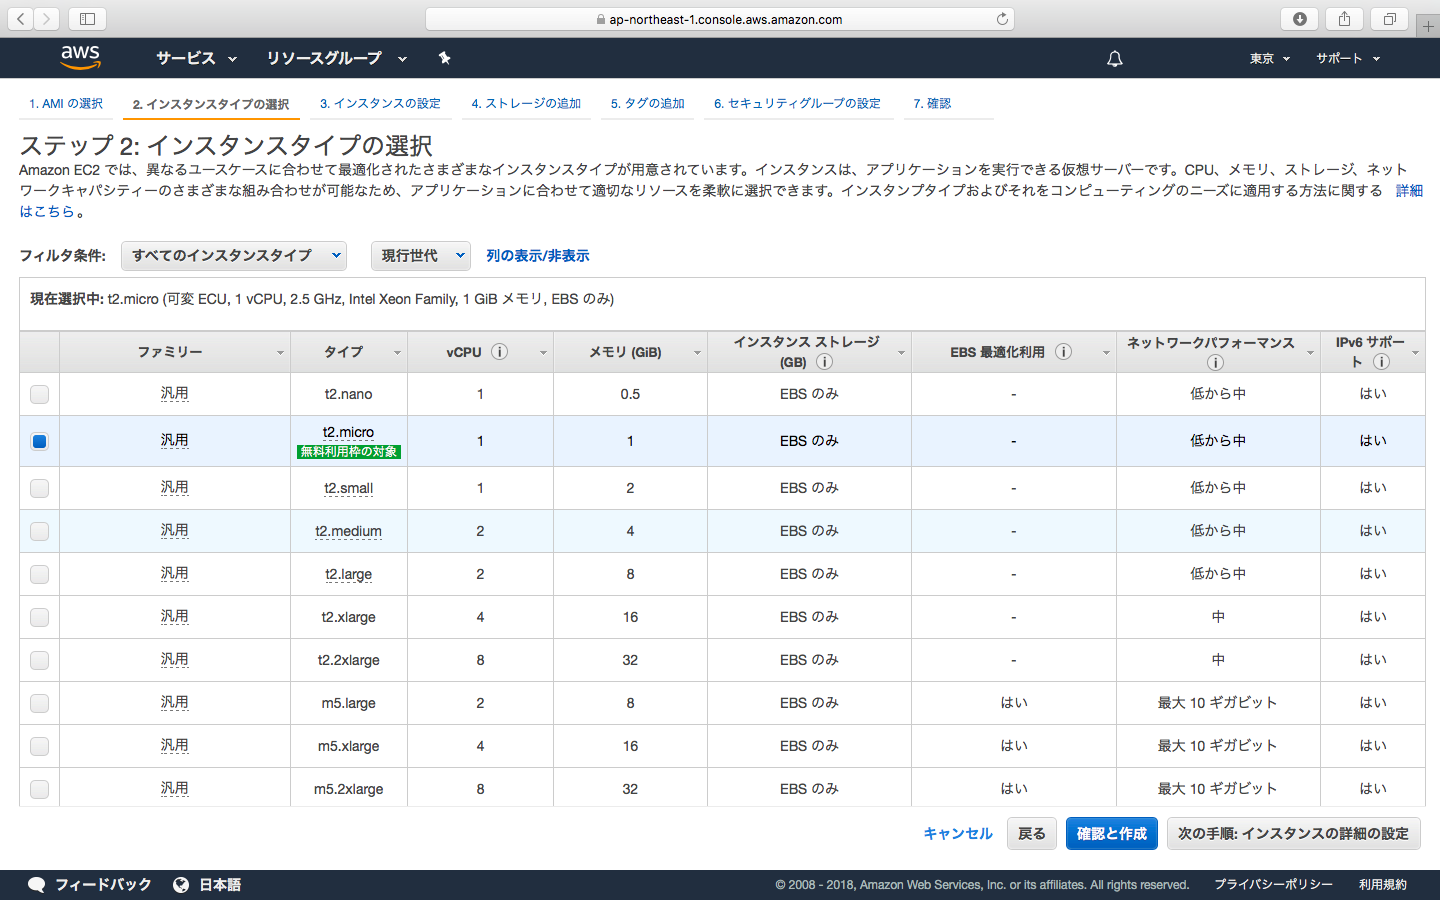
インスタンスタイプの選択で無料利用枠の対象であるt2.microを選択
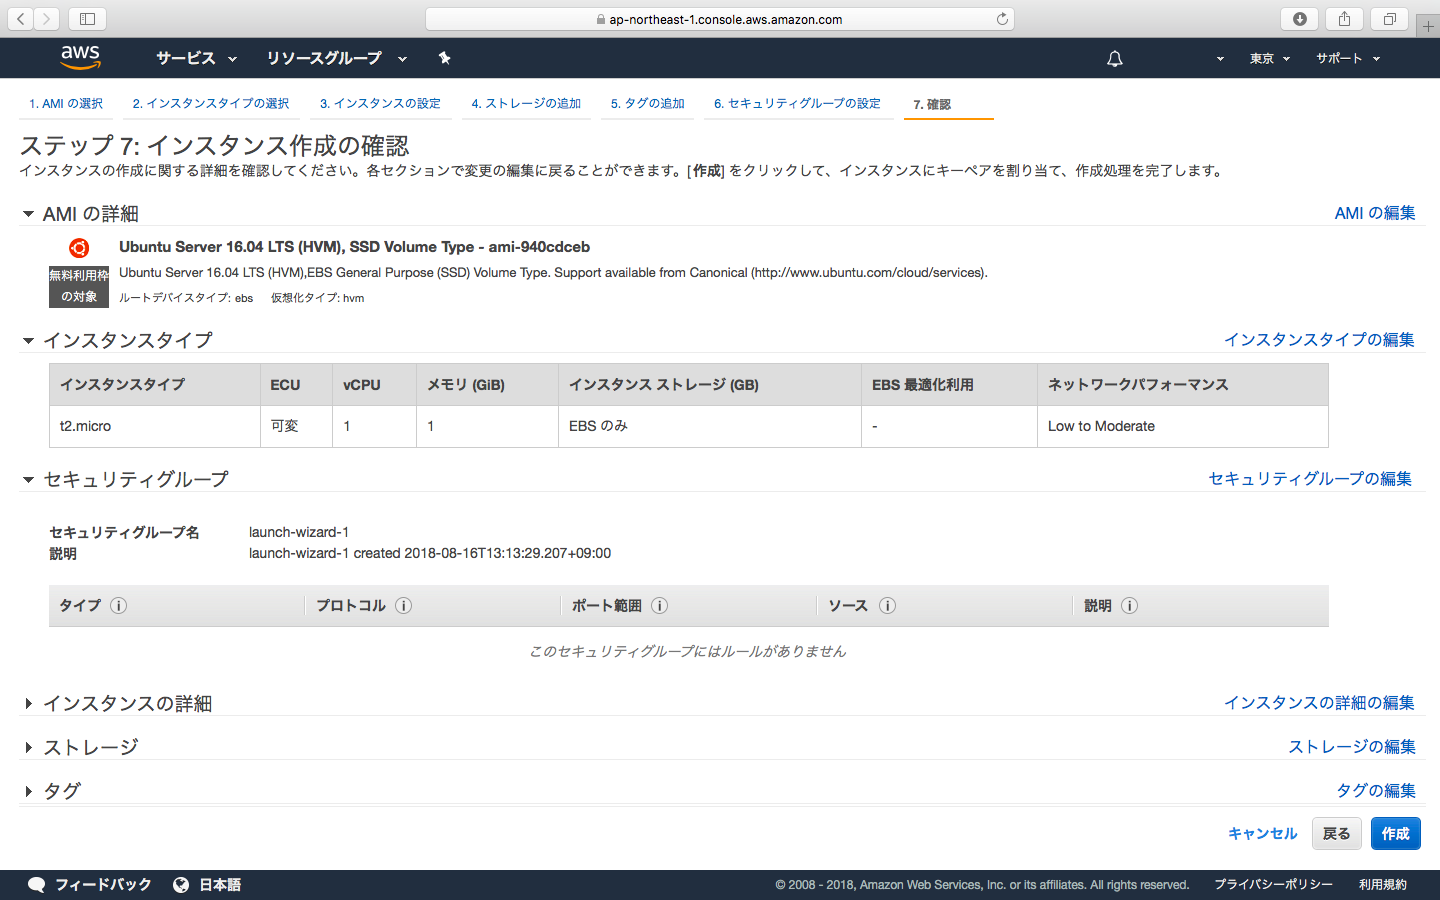
インスタンスの作成と確認の画面で右下の作成をクリック
キーペアの作成。新しくキーペアを作成してキーファイルをダウンロードする
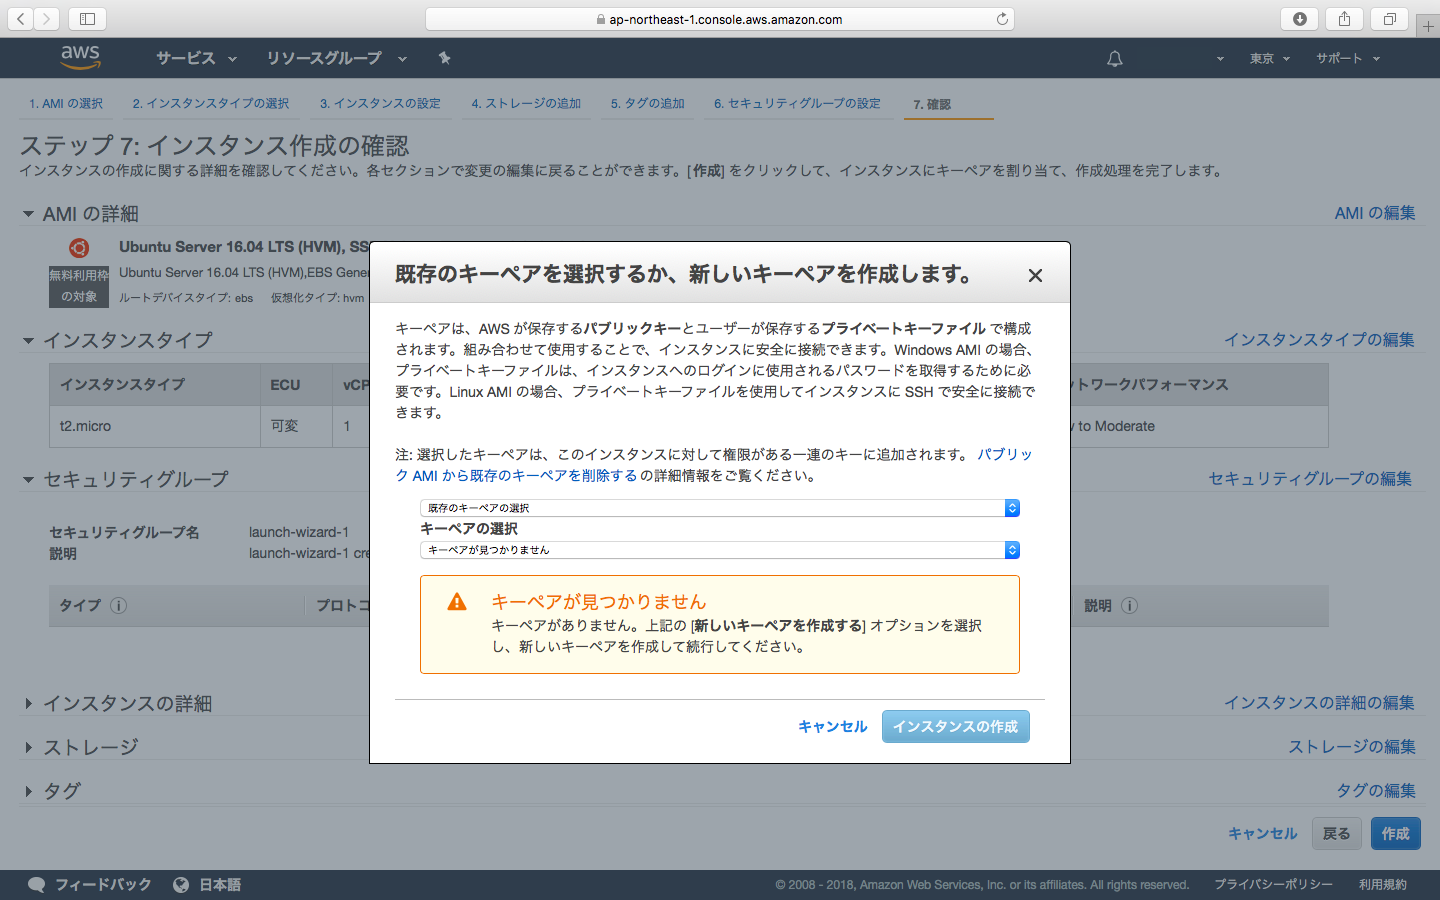
-
作成したペアキーをダウンロードして.ssh配下に配備(どこに置いても良いと思うが慣例的にここにいれておこう)
mv ~/Downloads/maypairkey.pem .ssh/ キーペア作成画面で「インスタンスの作成」をクリックするとインスタンスの作成が始まる。数分待てば立ち上がってきます。
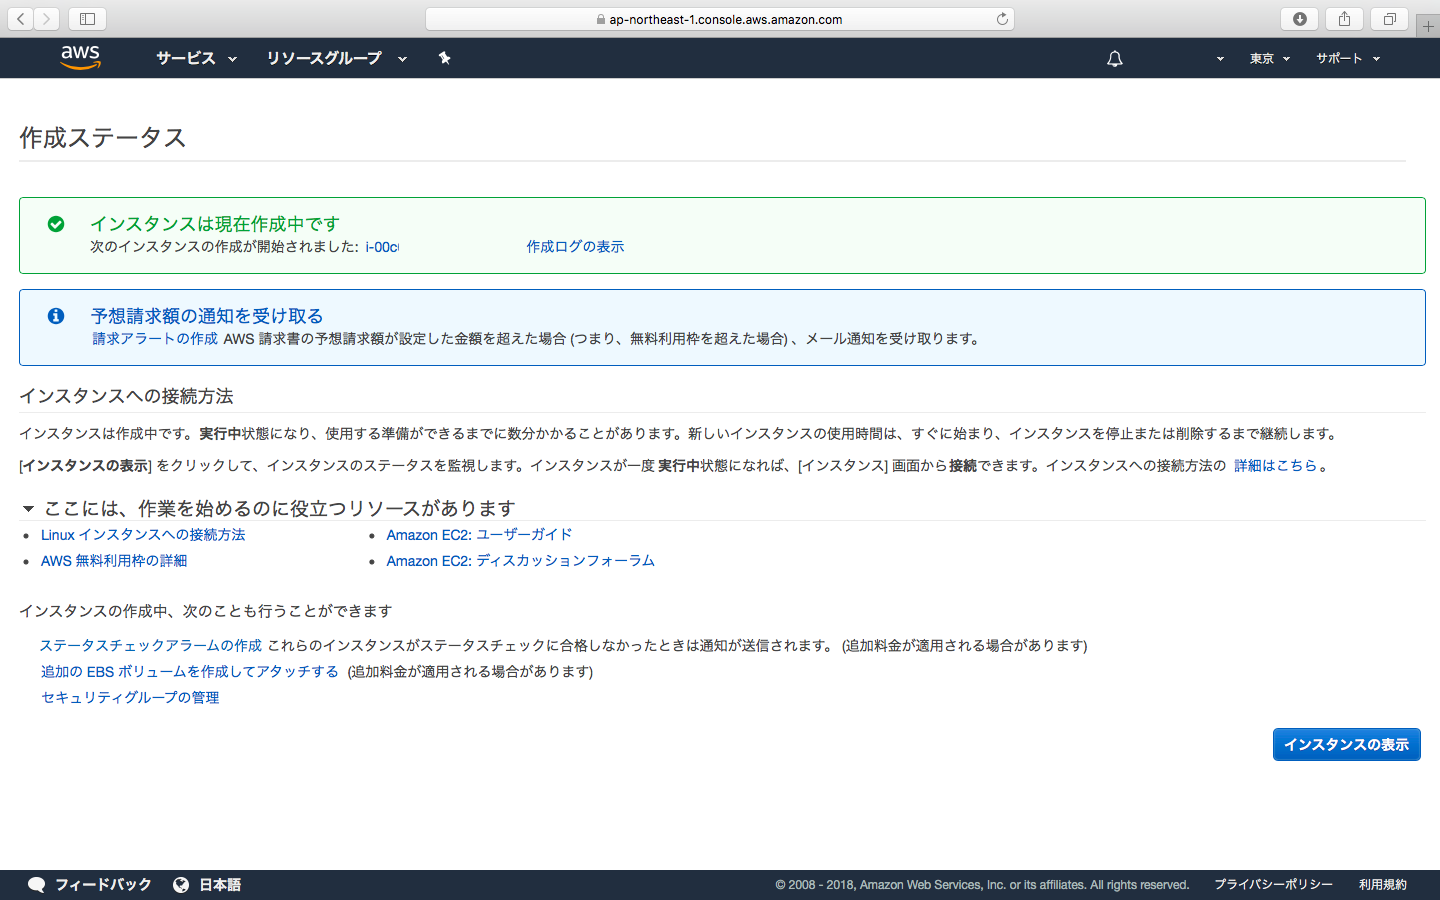
-
SSHログインしてみる
ユーザ名はubuntuの場合はubuntuがデフォルトらしいのでそのユーザ名で先ほどのキーを使ってログインします。
https://docs.aws.amazon.com/ja_jp/AWSEC2/latest/UserGuide/managing-users.htmlssh -l [username] -i [keypairfile] [ip_address or domain name]
EC2インスタンスの基本設定
基本設定
まずは基本的な設定と必要なプログラムのインストールを実施します。
% sudo apt-get update
% sudo apt-get -y upgrade
% sudo apt-get -y install vim zsh python3 python3-pip
ログインユーザのパスワード設定
次にユーザのパスワードを設定します。これをしておかないとchshの時に求められるPasswordが通らなかった。デフォルトは/etc/shadowが「*」になっており、パスワード認証が通らない設定になっていました。
参考
% sudo passwd ubuntu
Enter new UNIX password:
Retype new UNIX password:
passwd: password updated successfully
シェルをzshに
デフォルトのシェルをzshに変更。これは完全に好みです。
% chsh
Password:
Changing the login shell for ubuntu
Enter the new value, or press ENTER for the default
    Login Shell [/bin/bash]: /usr/bin/zsh
zshとvimの設定
zshとvimに好みの設定を入れていきます。これも完全に好みです。
- zshの設定はこれ https://qiita.com/cielo1985/items/6d32e2ec7c74ee60dca7
- vimの設定はこれ https://qiita.com/cielo1985/items/8b26cb292a8ef99255b7
ただしvimはver8にしないとdeinをインストールできないので、以下の手順でバージョンを上げる。
https://itsfoss.com/vim-8-release-install/
% sudo add-apt-repository ppa:jonathonf/vim
% sudo apt update
% sudo apt install vim
これで基本設定は完了です。
Elasticsearchのインストール
まずはJavaをインストール
% sudo apt install openjdk-8-jdk
% java -version
openjdk version "1.8.0_181"
OpenJDK Runtime Environment (build 1.8.0_181-8u181-b13-0ubuntu0.16.04.1-b13)
OpenJDK 64-Bit Server VM (build 25.181-b13, mixed mode)
Elasticsearchのインストール
この手順を元に実施しました。apt-getよりaptの方がいけてると聞いたのでapt-getは全てaptに置き換えて実施しようとしましたが、途中忘れたりしてaptの所とapt-getの所とバラバラになってしまいました(反省)。
public signing keyをダウンロードしてきてインストールします。
% wget -qO - https://artifacts.elastic.co/GPG-KEY-elasticsearch | sudo apt-key add -
apt-transport-httpsのインストールが必要な場合があるとのこと。今回はすでに最新版がインストールされていたようで特に必要ありませんでした。
% sudo apt install apt-transport-https
Reading package lists... Done
Building dependency tree
Reading state information... Done
apt-transport-https is already the newest version (1.2.27).
0 upgraded, 0 newly installed, 0 to remove and 3 not upgraded.
リポジトリの定義を/etc/apt/sources.list.d/elastic-6.x.listに保存する。
% echo "deb https://artifacts.elastic.co/packages/6.x/apt stable main" | sudo tee -a /etc/apt/sources.list.d/elastic-6.x.list
deb https://artifacts.elastic.co/packages/6.x/apt stable main
Elasticsearchをインストールする
% sudo apt update && sudo apt install elasticsearch
Elasticsearchの自動起動設定
まずはSysV initかsystemsのどちらが動いているか確認します。
% ps -p 1
  PID TTY          TIME CMD
    1 ?        00:00:04 systemd
このubuntuではsystemdが動いているようです。systemdを使った手順に進みます。
% sudo /bin/systemctl daemon-reload
% sudo /bin/systemctl enable elasticsearch.service
2つ目のコマンドでエラーが出ました。localeの設定がうまくいかない的な感じです。
[追記:2018.08.20] よく見るとwarningばかりですね。Created symlink from /etc/systemd/system/multi-user.target.wants/elasticsearch.service to /usr/lib/systemd/system/elasticsearch.service.も出ているので、うまくいっていたのかもしれません。
% sudo /bin/systemctl enable elasticsearch.service
Synchronizing state of elasticsearch.service with SysV init with /lib/systemd/systemd-sysv-install...
Executing /lib/systemd/systemd-sysv-install enable elasticsearch
perl: warning: Setting locale failed.
perl: warning: Please check that your locale settings:
    LANGUAGE = (unset),
    LC_ALL = (unset),
    LANG = "ja_JP.UTF-8"
    are supported and installed on your system.
perl: warning: Falling back to the standard locale ("C").
perl: warning: Setting locale failed.
perl: warning: Please check that your locale settings:
    LANGUAGE = (unset),
    LC_ALL = (unset),
    LANG = "ja_JP.UTF-8"
    are supported and installed on your system.
perl: warning: Falling back to the standard locale ("C").
Created symlink from /etc/systemd/system/multi-user.target.wants/elasticsearch.service to /usr/lib/systemd/system/elasticsearch.service.
export LC_ALL=Cをした後だとうまくいきました。
% export LC_ALL=C
% sudo /bin/systemctl enable elasticsearch.service
Synchronizing state of elasticsearch.service with SysV init with /lib/systemd/systemd-sysv-install...
Executing /lib/systemd/systemd-sysv-install enable elasticsearch
実はpythonにてpipでモジュールを入れようとしたら同じようなエラーになったことがありました。
pythonでpip3 insatall [module_name]を打つと以下のようなエラーが。
locale.Error: unsupported locale setting
この時も以下を入れると治りました。.zshrcに書いておいたほうがよさそうです。
% export LC_ALL=C
話が横道に逸れましたがこれで自動起動されるようになりました。ではElasticsearchを起動してみましょう。
sudo systemctl start elasticsearch.service
[追記:2018.08.20]systemctl statsuコマンドを使えば起動状況が確認できました。active(running)となっていればOKですね。
% sudo systemctl status elasticsearch
● elasticsearch.service - Elasticsearch
   Loaded: loaded (/usr/lib/systemd/system/elasticsearch.service; enabled; vendor preset: enabled)
   Active: active (running) since Mon 2018-08-20 20:06:43 JST; 38min ago
     Docs: http://www.elastic.co
 Main PID: 1130 (java)
    Tasks: 50
   Memory: 527.2M
      CPU: 47.966s
   CGroup: /system.slice/elasticsearch.service
           ├─1130 /usr/bin/java -Xms256m -Xmx256m -XX:+UseConcMarkSweepGC -
〜後略〜
sytemctlコマンドでは実行がうまくいったかどうか表示してくれません。正しく起動したかログを見て確認します。
% sudo ls -la /var/log/elasticsearch
total 32
drwxr-x--- 2 elasticsearch elasticsearch  4096 Aug 16 05:12 ./
drwxr-xr-x 9 root          syslog         4096 Aug 16 05:01 ../
-rw-r--r-- 1 elasticsearch elasticsearch  1021 Aug 16 05:12 gc.log.0.current
-rw-r--r-- 1 elasticsearch elasticsearch 20197 Aug 16 05:12 hs_err_pid13055.log
エラーが出てます。hs_err_pid13055.logを見てみます。
% sudo head /var/log/elasticsearch/hs_err_pid13055.log
#
# There is insufficient memory for the Java Runtime Environment to continue.
# Native memory allocation (mmap) failed to map 986513408 bytes for committing reserved memory.
# Possible reasons:
#   The system is out of physical RAM or swap space
#   In 32 bit mode, the process size limit was hit
# Possible solutions:
#   Reduce memory load on the system
#   Increase physical memory or swap space
#   Check if swap backing store is full
メモリーが不足しているようです。986,513,408 bytes割り当てようとして失敗したような感じがします。
今回作成したインスタンスのメモリーを確認します。
% free
              total        used        free      shared  buff/cache   available
Mem:        1014516       56780      236744        3320      720992      771952
Swap:             0           0           0
total 1,014,516 bytes、つまり約1GBytesしかないところに986MBytesも割り当てようとしています。それは失敗しそう。なのでメモリ割り当て量を調整します。
% sudo vi /etc/elasticsearch/jvm.options

#-Xms1g
#-Xmx1g
-Xms256m
-Xmx256m
再起動してうまくいったかどうか確認します。
% sudo systemctl start elasticsearch.service
% sudo ls -la /var/log/elasticsearch
total 60
drwxr-x--- 2 elasticsearch elasticsearch  4096 Aug 16 05:23 ./
drwxr-xr-x 9 root          syslog         4096 Aug 16 05:01 ../
-rw-r--r-- 1 elasticsearch elasticsearch  4435 Aug 16 05:23 elasticsearch.log
-rw-r--r-- 1 elasticsearch elasticsearch     0 Aug 16 05:23 elasticsearch_access.log
-rw-r--r-- 1 elasticsearch elasticsearch     0 Aug 16 05:23 elasticsearch_deprecation.log
-rw-r--r-- 1 elasticsearch elasticsearch     0 Aug 16 05:23 elasticsearch_index_indexing_slowlog.log
-rw-r--r-- 1 elasticsearch elasticsearch     0 Aug 16 05:23 elasticsearch_index_search_slowlog.log
-rw-r--r-- 1 elasticsearch elasticsearch 22949 Aug 16 05:23 gc.log.0.current
-rw-r--r-- 1 elasticsearch elasticsearch 20197 Aug 16 05:12 hs_err_pid13055.log
「err」を含むファイルが出ていないのでうまくいってそうです。試しにElasticsearchに対してGETしてみます。
% curl http://localhost:9200/
{
  "name" : "tznUzlS",
  "cluster_name" : "elasticsearch",
  "cluster_uuid" : "mC6muENgRCa5j0cWh7mRYg",
  "version" : {
    "number" : "6.3.2",
    "build_flavor" : "default",
    "build_type" : "deb",
    "build_hash" : "053779d",
    "build_date" : "2018-07-20T05:20:23.451332Z",
    "build_snapshot" : false,
    "lucene_version" : "7.3.1",
    "minimum_wire_compatibility_version" : "5.6.0",
    "minimum_index_compatibility_version" : "5.0.0"
  },
  "tagline" : "You Know, for Search"
}
いい感じです!日本語検索ができるようにkuromojiプラグインをインストールします。
(参考)
pluginのインストール方法
analysis-kuromoji
% sudo /usr/share/elasticsearch/bin/elasticsearch-plugin install analysis-kuromoji
これにてElasticsearchのインストールは完了です。次はKibanaです。
Kibanaのインストール
Kibanaのインストール
この手順を参考に実施します。
リポジトリの登録はElasticsearchのインストール手順で完了しているのでapt-get installから始まります。
% sudo apt-get update && sudo apt-get install kibana
Elasticsearchの時と同様にsystemdに登録します。
% sudo /bin/systemctl daemon-reload
% sudo /bin/systemctl enable kibana.service
Synchronizing state of kibana.service with SysV init with /lib/systemd/systemd-sysv-install...
Executing /lib/systemd/systemd-sysv-install enable kibana
Kibanaを起動します。
% sudo systemctl start kibana.service
うまく起動したかわからないのでcurlでKibanaにアクセスしてみます。Kibanaのデフォルトポート番号は5601です。
[追記:2018.08.20]こちらもsudo systemctl status kibanaで確認するのがGOODですね。
% curl http://localhost:5601
<script>var hashRoute = '/app/kibana';
var defaultRoute = '/app/kibana';

var hash = window.location.hash;
if (hash.length) {
  window.location = hashRoute + hash;
} else {
  window.location = defaultRoute;
}</script>%
うまくいってそうですね。
Kibanaの設定
外部からのアクセスを許可するためにserver.hostを0.0.0.0に設定変更してKibanaを再起動します。
% sudo vi /etc/kibana/kibana.yml

#server.host: "localhost"
server.host: "0.0.0.0"

% sudo systemctl restart kibana.service
AWSのセキュリティグループの編集
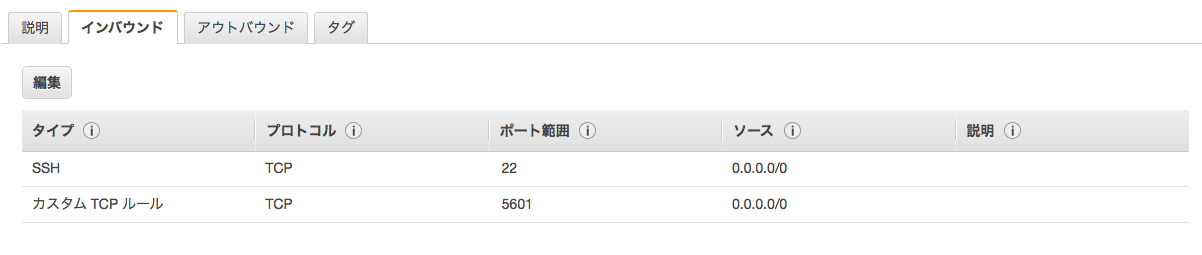
AWSのセキュリティグループの設定を編集し、5601へ外部からもアクセスできるようにします。
まずはKibanaを動かしているインスタンスのセキュリティグループを確認。
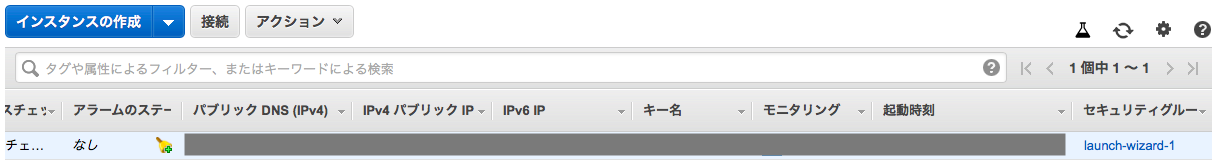
そのセキュリティグループの設定でTCP/5601を許可する行を追加します。
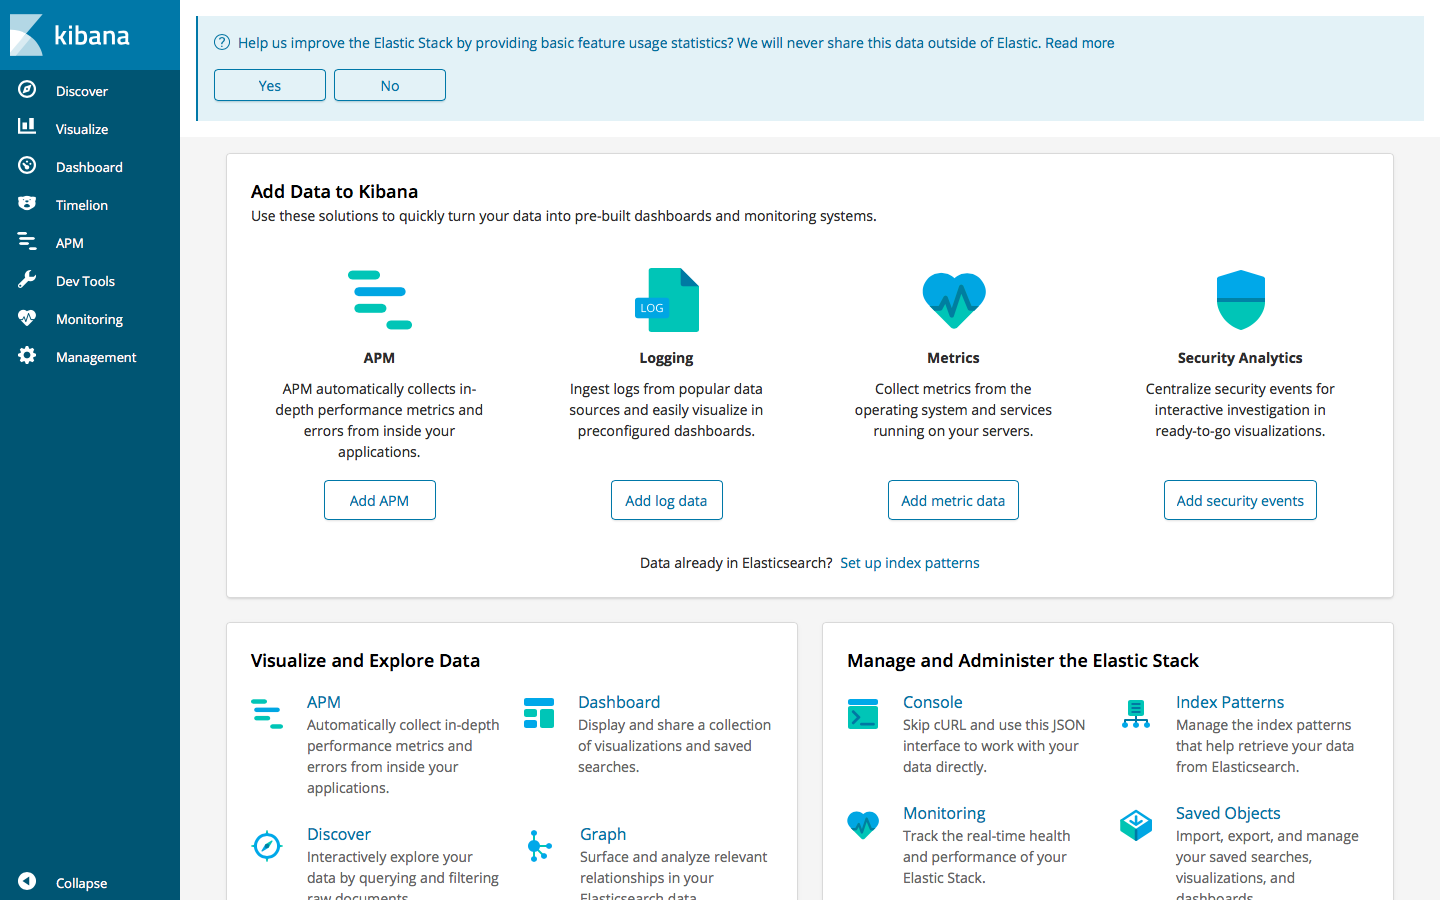
最終確認
Kibanaにアクセスしてみます。このような画面が出れば成功です!
Logstashのインストール
最後にLogstashのインストールです。これまでの手順をこなしていれば1行入れればOK。
https://www.elastic.co/guide/en/logstash/current/installing-logstash.html
% sudo apt-get update && sudo apt-get install logstash

Using provided startup.options file: /etc/logstash/startup.options
OpenJDK 64-Bit Server VM warning: INFO: os::commit_memory(0x00000000c5330000, 986513408, 0) failed; error='Cannot allocate memory' (errno=12)%]
/usr/share/logstash/bin/system-install: line 88: #: command not found
chmod: cannot access '/etc/default/logstash': No such file or directory
dpkg: error processing package logstash (--configure):
 subprocess installed post-installation script returned error exit status 1
Errors were encountered while processing:
 logstash
E: Sub-process /usr/bin/dpkg returned an error code (1)
と思いきやエラー。どうやらmemory allocationがうまくいっていないみたいです。
jvm.optionsに1g割り当てるよう設定が入っているのでこれを256mに変更します。
% sudo vi /etc/logstash/jvm.options

#-Xms1g
#-Xmx1g
-Xms256m
-Xmx256m
改めて実行します。
% sudo apt install logstash
Reading package lists... Done
Building dependency tree
Reading state information... Done
logstash is already the newest version (1:6.3.2-1).
0 upgraded, 0 newly installed, 0 to remove and 0 not upgraded.
1 not fully installed or removed.
After this operation, 0 B of additional disk space will be used.
Do you want to continue? [Y/n] y
perl: warning: Setting locale failed.
perl: warning: Please check that your locale settings:
    LANGUAGE = (unset),
    LC_ALL = (unset),
    LANG = "ja_JP.UTF-8"
    are supported and installed on your system.
perl: warning: Falling back to the standard locale ("C").
locale: Cannot set LC_CTYPE to default locale: No such file or directory
locale: Cannot set LC_MESSAGES to default locale: No such file or directory
locale: Cannot set LC_ALL to default locale: No such file or directory
Setting up logstash (1:6.3.2-1) ...
Using provided startup.options file: /etc/logstash/startup.options
Successfully created system startup script for Logstash
今度はうまくいったようです。
% sudo systemctl start logstash
% sudo systemctl status logstash
% sudo systemctl status logstash.service
● logstash.service - logstash
   Loaded: loaded (/etc/systemd/system/logstash.service; disabled; vendor preset: enabled)
   Active: active (running) since Sat 2018-08-18 21:10:37 UTC; 2min 21s ago
 Main PID: 1717 (java)
    Tasks: 13
   Memory: 192.3M
      CPU: 7.730s
   CGroup: /system.slice/logstash.service
           └─1717 /usr/bin/java -Xms256m -Xmx256m -XX:+UseParNewGC -XX:+UseConcMarkSweepGC -XX:CMSInitiatingOccupancyFraction=75 -XX:+UseCMSInitiatingOccupancyOnly

Aug 18 21:10:37 ip-172-31-38-107 systemd[1]: Started logstash.
無料枠ならではの課題
上記の手順でElasticsearch、Kibana、Logstashのインストールは完了しました。しかし全てを起動するとメモリーが足りなくなりssh接続すらままならない状態に陥ってしまいました。jvm.optionsで256mを128mにするなど試行錯誤しましたが、Elasticsearchがメモリーの約50%を使っており(これはXmx,Xmsを128mにしても減らない)、Kibanaが17%使って他はもう動かない、そんな感じでした。
ですので今回はLogstashはあきらめてPythonのtweepyを使ってTwitterのデータ取得を行うことにしました。
[追記:2018.08.20] ElasticsearchとKibanaだけでも900M近く使っておりたまにsshすら繋がらなくなります。その時はrebootして復旧していますが時間が経つと固まってしまいます。無料枠で実現するには荷が重すぎるのかもしれません。
今後について
これまで、環境準備は行き当たりばったりでやってしまって再現できないことが多いので丁寧にまとめて見ました。これをまとめるために3回ほどインスタンスを立ち上げ直して同じ手順をやっています。手順を全てメモし切ったつもりでも書き忘れたあり、やるたびに「あ、これ忘れてた」ってことが何度かありました。ここまでまとめれば大丈夫だと思うので、やっと次回は本番のTwitter分析に入りたいと思います。長くなったので記事を分けます。