sin とか cos とか、どーでもいいから、取り敢えず単純に外部データをプロットさせたいんだよ!
ってメモ
描画対象
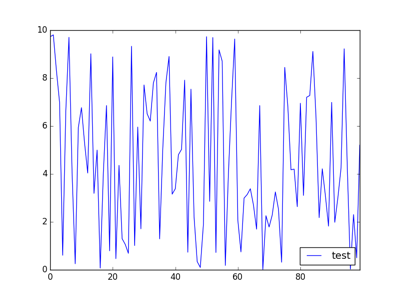
ランダムに 100 個の値を羅列したもの。
A
$ perl -le 'print rand (10) for 0 .. 99' > rand.txt
matplotlibのみ
A 実行後、同じディレクトリで↓実行
import matplotlib
matplotlib.use('Agg')
import matplotlib.pyplot as plt
f = open("rand.txt", "r")
x = []
y = []
for i, line in enumerate(f):
    x.append(i)
    y.append(float(line))
plt.title("data")
plt.xlabel("x")
plt.ylabel("y")
plt.plot(x,y)
plt.savefig("graph.png")
pandas使ったら
同様に。
import matplotlib
matplotlib.use('Agg')
import pandas as pd
import matplotlib.pyplot as plt
data = pd.read_csv("rand.txt", header=None)
data.columns= [ 'test' ]
data.plot()
plt.savefig("graph.png")
