あるGPSの情報だけから、「今移動しているのか、移動しているなら何で移動しているのか」を抽出したいとします。
アルゴリズムが簡単な「kmeans」でやってみましょう。
以下のリストは時系列の移動速度のリストです。(283個)
list = [5.64027462918436, 7.044816660841681, 9.743844576451258, 13.888241316185976, 15.697208783354496, 2.663893978164146, 0.08561004863115136, 22.159437109710158, 58.853580246357154, 24.045457827344013, 9.402411129828979, 1.4946093092495798, 0.6764983076962048, 2.8319293372846674, 0.5055205423739224, 1.8570278904919986, 1.755211593483243, 0.28339041990617164, 1.0613157770294608, 0.4374489768175194, 0.8651695235123957, 0.32466729618643764, 0.909587395114629, 0.11474482583993588, 18.291404299546574, 0.6282261615352588, 22.764442500820113, 14.771135751099104, 10.018041198655999, 3.5318797484833038, 0.8427852307640956, 0.4633047605151175, 1.2614847490320495, 0.302187308182266, 5.464355063498731, 0.42553095064562, 3.586196569716906, 10.508209764544715, 12.443991111739024, 12.918240282000014, 10.860805300129627, 11.343595432273684, 9.074497388141678, 9.395074612169742, 14.071890051276299, 10.542362087044323, 12.673446992660587, 9.543528666900608, 10.021352177287548, 11.792707446788153, 10.637798236925716, 10.97997302459006, 12.329764831776181, 15.92938620958969, 16.569478962696458, 16.844662867157506, 18.464738190405136, 21.720654099507723, 19.8271825264156, 23.867134812795854, 20.859950272328806, 21.967240295301007, 26.57309365025015, 24.498589968115343, 25.371290014343487, 25.837627037399244, 24.867503776333162, 29.698700625359596, 27.66637891212303, 29.377000985957007, 27.985394370510836, 28.918089344042123, 28.70687460464253, 31.656247578668154, 30.92571544163547, 36.801859006176215, 29.92375507100213, 33.015362212527684, 27.041191199333362, 24.245515474863197, 31.69018781146021, 41.272016204684085, 33.50569121112813, 35.34243779921202, 30.30573001818681, 34.870403710912555, 35.38214822124045, 35.86673473440379, 35.115201011702084, 33.28365861848483, 33.86906670033461, 33.145698543602855, 36.26331373961144, 36.439458891349396, 38.41613810605032, 35.11406246076868, 35.447315686736914, 33.15228347163752, 32.70506594412408, 35.97073946630422,35.05543597155593, 33.97095160809346, 33.18966007714795, 30.852092862903614, 27.633131597107063, 29.49545921062464, 31.257126697883372, 32.94333900807048, 22.501964572486738, 25.89720036761842, 24.402303659663865, 21.52642854990259, 22.725364332784373, 19.75638074518497, 20.144550864212153, 19.559563686972265, 19.234658980978185, 19.057587762693267, 15.27139422889493, 15.685708157456016, 14.069570881973823, 13.23819767171697, 10.582797515120488, 13.327921980492395, 11.711652447884017, 6.834890596577483, 9.670969053131508, 7.8671095139005445, 2.401467580513379, 2.201843310335587, 0.9954715642712374, 0.7194103646952628, 2.7847342398964323, 3.4622898379303018, 3.000409155261903, 0.5940167604593146, 1.1799753084253475, 3.464006515717891, 2.2274638843311325, 3.4946694821256927, 11.85728328274822, 3.5213733181480644, 1.0195005886335917, 1.8458053000554133, 2.2854684926208133, 1.3617791815980596, 1.3119310810641416, 1.5308676088092437, 1.78300600991815, 1.72159095409297, 1.4598219567494926, 1.469870786923412, 1.4901437913981748, 1.3149961897850861, 1.288312542243502, 1.4745765732667413, 1.2969561913910146, 1.308373289589097, 1.2463524312806407, 1.3733014856747692, 1.439594633854213, 1.2621953562279524, 1.0821234604929661, 0.6111033231539594, 0.5624357538288809, 0.8415075479761349, 1.6795752482580777, 2.280071805062977, 48.297602452286775, 13.746916322212059, 5.724451285293235, 5.206018140830609, 6.052122824327688, 5.480215098629106, 5.221429381399287, 4.543260174295754, 4.325410413015476, 5.114808164688378, 6.836031410127568, 4.752090362801353, 5.166754348412256, 4.485717669041212, 4.43206756512132, 4.52544684420403, 5.190104611989542, 5.357809673836258, 4.69919906117541, 5.118267913181395, 4.7896053582485925, 4.726484599491905, 5.071422783178972, 4.762505884377611, 5.40537623436878, 4.837769452964542, 5.330170636122883, 5.134072825591236, 5.5209011431931545, 5.619004820176745, 5.480342308834578,5.611194962373728, 5.606073996758446, 6.213835565423396, 5.6850888496292775, 6.055573749201287, 11.80443368479868, 6.2930618286932045, 5.5472858158220815, 6.070753044548943, 5.03460656872975, 5.412908224593471, 5.00321756515303, 5.655295587652858, 0.3126270020084432, 3.8139675456906046, 6.295113879934982, 4.981194637102781, 4.920982552158612, 4.431300240677465, 3.8580934321270552, 5.765552388942844, 5.5657570290572345, 5.2264888938981855, 5.158457308253841, 5.559520338226415, 5.455507647247521, 5.453077306737964, 5.494126412888633, 5.7690646985220395, 5.504338818901616, 6.285937990844853, 5.63891811546452, 4.886665337087724, 4.548403695593803, 4.148570421238408, 4.899074530924985, 4.4643604770200005, 4.113277356963036, 5.115812804556654, 4.889496231000794, 5.57477198290147, 4.529727366194392, 4.702180050896918, 4.418141728329032, 5.279701403035507, 5.636943888891846, 4.487253154484606, 4.516270714971138, 4.572351762288701, 4.674296458756527, 4.700896556586107, 4.620273311629987, 4.842754339057832, 4.870878782103889, 4.618556996790444, 5.155642391130246, 5.046665495657079, 5.050733337607236, 5.981159948731207, 5.348934149813606, 5.902266299708016, 5.487128555300578, 6.55426557747729, 5.422664030109949, 5.190179082533397, 6.427044817314412, 5.187014378092112, 5.654300436246806, 7.136301854761997, 5.231251167705132, 3.6469409516549067, 5.933953258383922, 5.209699454549939, 5.070509263566189, 5.496919807620743, 4.9509842156651604, 4.1673244029268, 5.108727268789651, 5.086457502154295, 5.329459009903756, 5.869475601795944, 5.541504540760004, 5.1596739778522585, 4.728142605241853]
これを
・止まっているか
・徒歩で移動しているか
・自転車で移動しているか
・電車で移動しているぁdenshadeidousiteirula
の4つに分類します。
(kmeansにおいて、分類数は人間が決めます。)
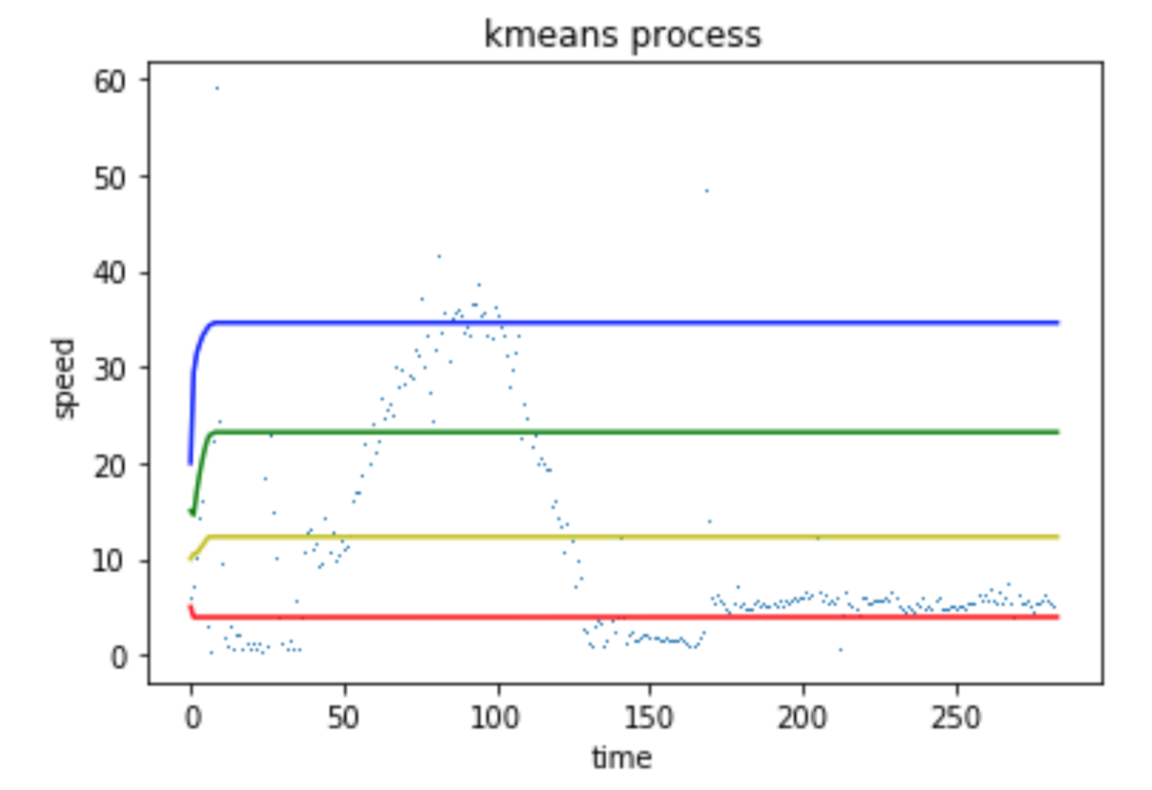
その過程をmatplotlibで可視化してみました。
import numpy as np
import matplotlib.pyplot as plt

# 移動速度を時系列で可視化
plt.plot(list, ',')
plt.title('kmeans process')
plt.xlabel('time')
plt.ylabel('speed')

# kmeansの重心を適当に設定する
k = [5,10,15,20]

# クラスターを4つに分ける
cluster1 = [k[0]]
cluster2 = [k[1]]
cluster3 = [k[2]]
cluster4 = [k[3]]

# kmeansのアルゴリズム
for j in range(100):
    class_list = [0,0,0,0]
    speed_list = [0,0,0,0]
    border1 = (k[0]+k[1])/2
    border2 = (k[1]+k[2])/2
    border3 = (k[2]+k[3])/2

    for i in range(len(list)):

        if list[i] < border1:
            class_list[0] += 1
            speed_list[0] += list[i]
        elif list[i] < border2:
            class_list[1] += 1
            speed_list[1] += list[i]
        elif list[i] < border3:
            class_list[2] += 1
            speed_list[2] += list[i]
        else:
            class_list[3] += 1
            speed_list[3] += list[i]

    for i in range(4):
        k[i] = speed_list[i] / class_list[i]

    cluster1.append(k[0])
    cluster2.append(k[1])
    cluster3.append(k[2])
    cluster4.append(k[3])

# kmeansの重心が動いている様子を可視化
plt.plot(cluster1, color='r')
plt.plot(cluster2, color='y')
plt.plot(cluster3, color='g')
plt.plot(cluster4, color='b')
plt.show()
結果
100回も回さなくても、10~15回で収束してますね。