前提
- 出力結果を PNG 画像として出力する。
- ラベルなどのグラフ内の文字に日本語を使用できる。
方法
ソース
Dockerfile
FROM python:3.6.2

RUN apt-get update \
 && apt-get install -y \
      git \
      unzip \
 && rm -rf /var/lib/apt/lists/*

# フォントとして Ricty Diminished をインストールする。
WORKDIR /usr/share/fonts
ENV RICTY_DIMINISHED_VERSION 3.2.4
ADD https://github.com/mzyy94/RictyDiminished-for-Powerline/archive/$RICTY_DIMINISHED_VERSION-powerline-early-2016.zip .
RUN unzip -jo $RICTY_DIMINISHED_VERSION-powerline-early-2016.zip \
 && fc-cache -fv

# Matplotlib 用の設定ファイルを用意する。
WORKDIR /etc
RUN echo "backend : Agg" >> matplotlibrc \
 && echo "font.family : Ricty Diminished" >> matplotlibrc

# Matplotlib をインストールする。
WORKDIR /opt/app
ENV MATPLOTLIB_VERSION 2.0.2
RUN pip install matplotlib==$MATPLOTLIB_VERSION

# Matplotlib を使ったサンプルスクリプトをコピーする。
COPY plot.py .
docker-compose.yml
version: '3.3'
services:
  plot:
    build: .
    environment:
      MPLCONFIGDIR: /etc
    volumes:
      - .:/opt/data-volume
    working_dir: /opt/data-volume
    entrypoint:
      - python
      - /opt/app/plot.py
plot.py
from matplotlib import pyplot as plt
if __name__ == '__main__':
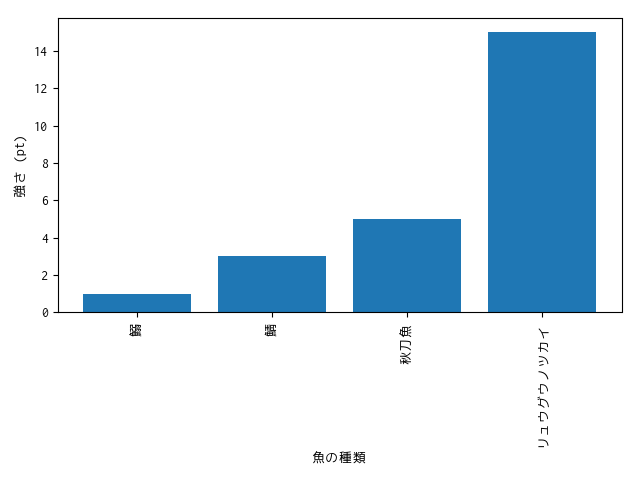
labels = ['鰯', '鯖', '秋刀魚', 'リュウグウノツカイ']
x = list(range(1, len(labels) + 1))
y = [1, 3, 5, 15]
plt.bar(x, y, align='center')
plt.xticks(x, labels, rotation='vertical')
plt.xlabel('魚の種類')
plt.ylabel('強さ (pt)')
plt.tight_layout()
plt.savefig('plot.png')
実行結果