1.matplotlibのscatter()で散布図を描画する
test.py
import pandas as pd
import matplotlib.pyplot as plt
from matplotlib.ticker import ScalarFormatter

# X軸の指数表記用Formatterクラス
class FixedOrderFormatter(ScalarFormatter):
    def __init__(self, order_of_mag=0, useOffset=True, useMathText=True):
        self._order_of_mag = order_of_mag
        ScalarFormatter.__init__(self, useOffset=useOffset,
                                 useMathText=useMathText)
    def _set_orderOfMagnitude(self, range):
        self.orderOfMagnitude = self._order_of_mag

#サンプル群1
lst1 = [1000000,50000,900000,20000]
df1 = pd.DataFrame()
df1['u'] = [390000,250000,400000,5000] #x1
df1['b'] = [0.4,0.3,0.5,0.25]  #y1
df1['p'] = [x/1000 for x in lst1]

#サンプル群2
lst2 = [50000,200000,9000,160000]
df2 = pd.DataFrame()
df2['u'] = [80000,30000,120000,50000] #x2
df2['b'] = [0.2,1.3,0.1,0.5] #y2
df2['p'] = [x/1000 for x in lst2]

#print(df1,df2)

## グラフ描画
#大枠
fig = plt.figure()
ax = fig.add_subplot(1,1,1)

#サンプル2群のプロット
ax.scatter(df1['u'],df1['b'], s=df1['p'], c='Blue',alpha=0.3)
ax.scatter(df2['u'],df2['b'], s=df2['p'], c='Red' ,alpha=0.3)

#装飾その1:表題、XY軸ラベル、X軸の目盛り
plt.title("This is a title")
plt.xlabel("x axis:u")
plt.ylabel("y axis:b")
ax.xaxis.set_major_formatter(FixedOrderFormatter(4)) #指数表記:10^4

#装飾その2:グリッド
ax.grid(which='minor', alpha=0.2)
ax.grid(which='major', alpha=0.5)
例えば、ページ数が8を超える群と、ページ数が4以下の群の2群のサンプルがあって、そのサンプル群のKPI(uとbとp)が3つ所与のものとした場合、uを散布図のX軸、bをY軸にした散布図は上記のようなスクリプトで描画可能。
で、上記ではマーカーの大きさをpによって可変にしている。(scatter()の引数sで指定)。当初対数logにしようかと思ったのだけれども、あまり大きさに差が出なかったので、上記では単純に1000で割っている。ここはもう少し改善の余地あり。
またサンプル群1の色をblue、サンプル群2の色をredにしている。(scatter()の引数cで指定)。あとマーカーが重なる場合があるので、透明度alphaを設定している。
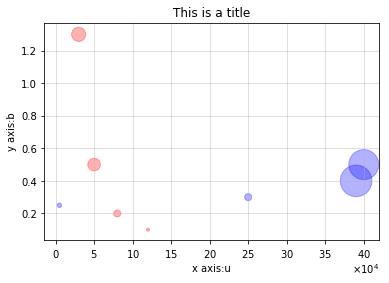
なお上記ではX軸のbの桁数が多いので、ゼロが横に長く並ぶのと可読性に欠けるので、X軸を指数表記に変更している。
2.参考
※参考その1:
matplotlib_scatter()について
https://pythondatascience.plavox.info/matplotlib/%E6%95%A3%E5%B8%83%E5%9B%B3)
※参考その2:
media×tech「記事のリード文にライターの自己紹介は必要か」:
→ このブログ記事では、リード文に自己紹介ありがサンプル群1で、リード文に自己紹介なしがサンプル群2で、サンプル群1とサンプル群2の、2つのサンプル群の散布図を描画している模様。