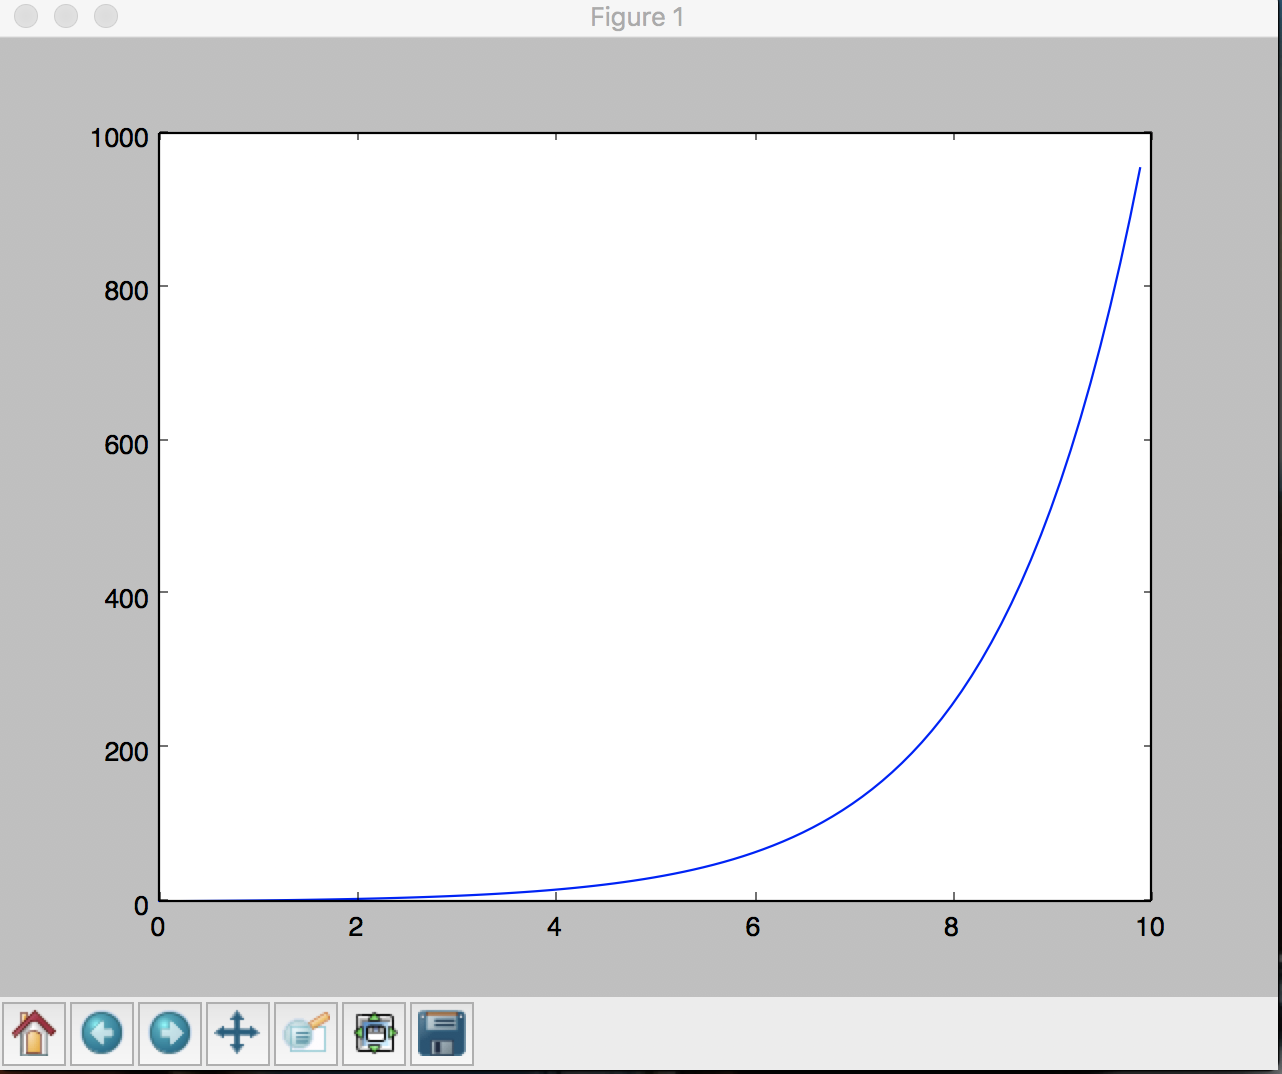
LoginSignup
3
2

More than 5 years have passed since last update.

【Python】指数関数をグラフにプロットする

Posted at

やりたいこと

指数関数をグラフにプロットする

※準備するものは以下のURLを参照してください。
https://qiita.com/Cesaroshun/items/69c9fad0cd24322559b2

手順

  • 指数関数を定義
  • グラフプロット実行

まとめて結論

以下の記述を行う。

math_training.py
import matplotlib.pyplot as plt
import numpy as np
import math

x = np.arange(0, 10, 0.1)

y = 2**x

plt.plot(x, y)
plt.show()

以下のグラフが出力される
スクリーンショット 2018-01-03 0.00.39.png

3
2
0

Register as a new user and use Qiita more conveniently

  1. You get articles that match your needs
  2. You can efficiently read back useful information
  3. You can use dark theme
What you can do with signing up
3
2