GeForce GTX 1070 (8GB)
ASRock Z170M Pro4S [Intel Z170chipset]
Ubuntu 16.04 LTS desktop amd64
TensorFlow v1.2.1
cuDNN v5.1 for Linux
CUDA v8.0
Python 3.5.2
IPython 6.0.0 -- An enhanced Interactive Python.
gcc (Ubuntu 5.4.0-6ubuntu1~16.04.4) 5.4.0 20160609
GNU bash, version 4.3.48(1)-release (x86_64-pc-linux-gnu)
scipy v0.19.1
geopandas v0.3.0
MATLAB R2017b (Home Edition)
ADDA v.1.3b6
処理概要
bash (Matplotlib ) + eog > リアルタイム画像表示処理
の続き。
- .plot()による折れ線グラフの描画
- データを追加しながらリアルタイム描画更新
- eogでの描画
matplotlibでリアルタイム描画に記載のset_data()を使ってみる。
code v0.1 > 0.3秒更新
Jupyterコード。
100データ追加までは描画更新して、最後にJupyter内にグラフを描画する。
import numpy as np
import matplotlib.pyplot as plt
import time
import sys

fig = plt.figure()
ax = fig.add_subplot(1, 1, 1)
ax.set_ylim(0, 1.0)
xs = []
ys = []
line1, = ax.plot(xs, ys)

for cnt, loop in enumerate(range(100)):
    xs += [ time.time() ]
    ys += [ np.random.rand(1) ]
    line1.set_data(xs, ys)
    if min(xs) != max(xs):
        ax.set_xlim(min(xs), max(xs))
    fig.savefig("sine.png")
    time.sleep(0.3)

fig.tight_layout()
plt.show()
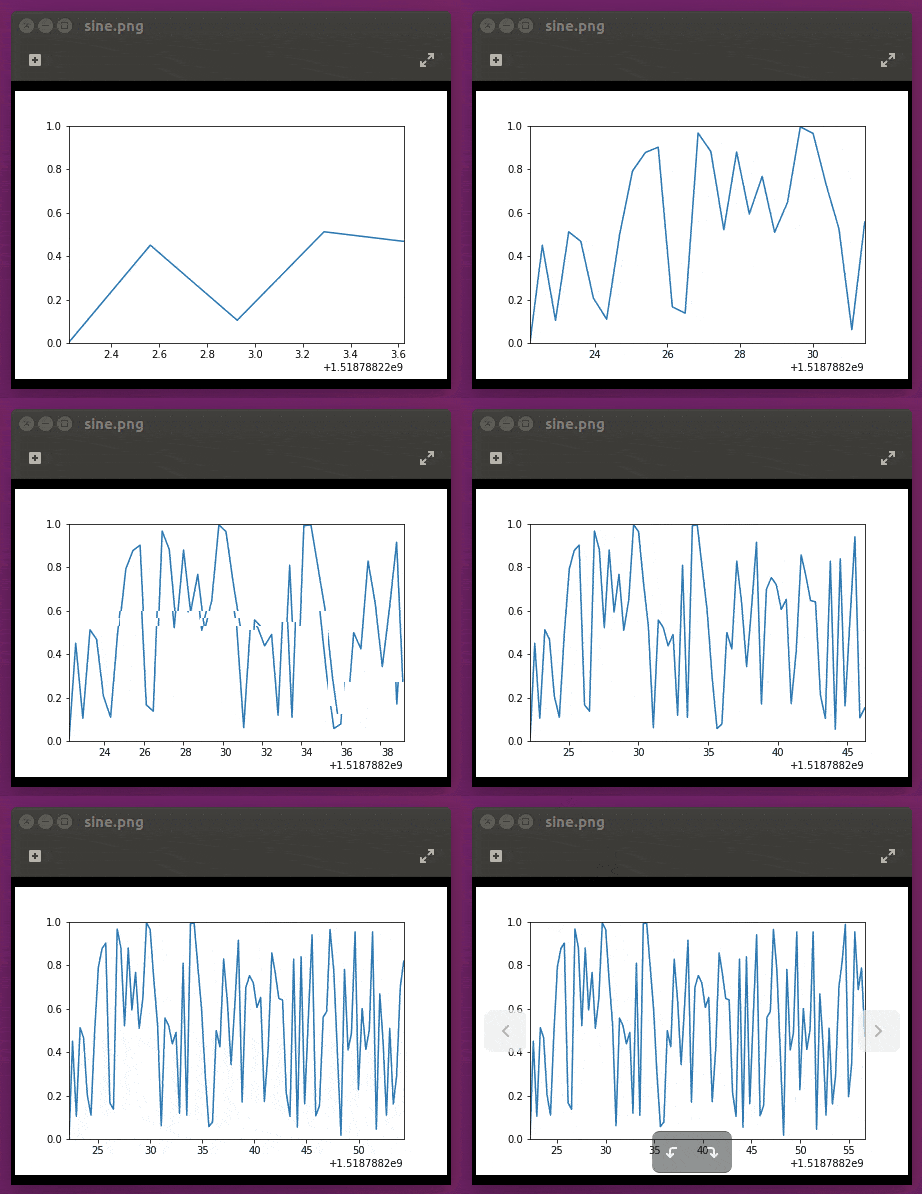
sine.pngが逐次更新されるので、以下で表示しておく。
$ eog sine.png
結果
PeekによるアニメーションGIFを試してみた(参考)。
(そして、https://ezgif.com/optimize で容量を減らしてみた。560KB程度)
不具合
eogを開いてからJupyterでの実行を繰返すと描画がおかしくなる場合がある。
JupyterのRestartでは復旧せず、eogを起動し直すことで復旧する。
長時間のリアルタイム表示には向かないかもしれない。
code v0.2 > 1秒更新
0.3秒更新をやめて1秒ごとの複数データ追加に変更してみた。
import numpy as np
import matplotlib.pyplot as plt
import time
import sys

fig = plt.figure()
ax = fig.add_subplot(1, 1, 1)
ax.set_ylim(0, 1.0)
xs = []
ys = []
line1, = ax.plot(xs, ys)

for cnt, loop in enumerate(range(100)):
    # xs += [time.time()]
    xs += [cnt]
    ys += [np.random.rand(1)]
    line1.set_data(xs, ys)
    if min(xs) != max(xs):
        ax.set_xlim(min(xs), max(xs))
    if cnt % 5 != 0:
        continue
    fig.savefig("sine.png")
    time.sleep(1.0)  # 0.3

fig.tight_layout()
plt.show()
eog側の不具合は見られなくなった。
0.3秒ごとのファイル保存ではeog側の処理とぶつかるのかもしれない。
v0.1で不具合があったときは、「eogで開いているファイルが別ソフトにて更新されました」のような感じのメッセージも見られた(正確なエラーメッセージではない)。
v0.2でも発生した。
画像 "sine.png"が別のアプリケーションによって変更されました。再読み込みしますか? [再読み込み(R)][隠す(D)]
上記が出た後はエラーメッセージが頻発するようになり、eogを再起動することになりそう。
code v0.3
sinecurveの表示にしてみた。
古いデータは適宜削除することで、スクロールのような表示にしている。
import numpy as np
import matplotlib.pyplot as plt
import time
import sys

NUM_ADD = 5

fig = plt.figure()
ax1 = fig.add_subplot(1, 1, 1)
ax1.set_ylim(-1.0, 1.0)
xs = []
ys1 = []
graph1, = ax1.plot(xs, ys1)

for cnt, loop in enumerate(range(2000)):
    if len(xs) > 50:
        del xs[0:NUM_ADD]
        del ys1[0:NUM_ADD]
    xs += [cnt]
    ys1 += [np.sin(cnt / 5)]
    graph1.set_data(xs, ys1)
    if min(xs) != max(xs):
        ax1.set_xlim(min(xs), max(xs))
    if cnt % NUM_ADD != 0:
        continue
    fig.savefig("sine.png")
    time.sleep(1.0)  # 0.3

fig.tight_layout()
plt.show()

