Q
ggplot2は、colourに変数をマッピングすると色の割り当てが勝手に決まってしまいます。この割り当てを「"blue"は青、"green"は緑...」というように自分で設定する方法はありますか?
d <- data.frame(x = 1:4, y = 1:4,
                colour = c("red", "green", "blue", "yellow"))

ggplot(d, aes(x, y, colour = colour)) +
  geom_point(size = 15)

A
このデータのように変数が色の名前になっている場合は、scale_colour_identity()が使えます。
ggplot(d, aes(x, y, colour = colour)) +
    geom_point(size = 15) +
    # scale_XXX_identityはguide="none"(凡例なし)がデフォルトなので、凡例を表示するには明示的に指定します。
    scale_colour_identity(guide = "legend")

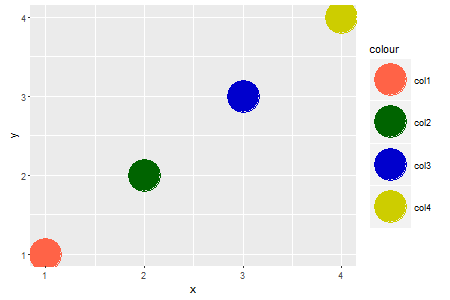
変数が色の名前でない場合や、もっと細かく色を指定したい場合にはscale_colour_manual()が使えます。
d <- data.frame(x = 1:4, y = 1:4,
                colour = c("col1", "col2", "col3", "col4"))

ggplot(d, aes(x, y, colour = colour)) +
  geom_point(size = 15) +
  scale_colour_manual(
    values = c(
      col1  = "tomato",
      col2  = "darkgreen",
      col3  = "blue3",
      col4  = "yellow3"
    )
  )
ggplot2で使える色の指定の仕方は以下のドキュメントが参考になると思います。