最近gnuplotが好きだ。(学校ぐらし!)
しかしgnuplot超初心者勢だから毎回タブを7つくらい開きつつ頑張っている。
流石にめんdなので、主に自分向けにまとめる。
基本
gnuplotは
http://www.gnuplot.info/download.html
で落とせる。
Windowsなので、./binのwgnuplot.exeを使う。
コピー&ペーストは [Ctrl]+[Insert]/[Shift]+[Insert]。msys2 mintty+bashとも微妙に違う。([Insert]だけで貼り付けられない)
今回使うデータ
(注意)BOM付きのデータは読めません。糞が。
0.0333667	129
1.434768101	112
2.235568902	100
3.003003003	88
3.770437104	80
4.537871205	73
5.305305305	66
6.106106106	61
6.873540207	58
7.640974308	55
8.408408408	51
9.175842509	48
9.94327661	45
10.71071071	43
11.47814481	41
12.24557891	39
13.04637971	37
13.78044711	35
14.54788121	34
15.34868202	34
16.11611612	33
16.88355022	31
17.65098432	30
18.41841842	29
19.18585252	29
19.95328662	28
20.72072072	27
21.48815482	27
22.25558892	26
23.02302302	25
軸のラベル設定
軸の名前のないグラフなんぞありえない。というわけで真っ先に設定する。
set xlabel "time /sec."
set ylabel "振幅 /mm"
参考サイト
軸の範囲設定
そのままの勢いで。もっともこれは一度plotしてから決めてもいいかもしれない。
set xrange [0:25]
set yrange [0:140]
参考サイト
近似線の導出(fitting)
今回のデータは減衰振動の振幅の変化なので
x(t)=Ae^{-\gamma t}
に従うので(sin以下は振動項で振幅はこれが1の時だから無視)これのAとγを求める。
f(x)=a*exp(b*x)
適当に関数を作りまして(fittingには元になる関数が必須です)
a=130
(任意)大体のAの値がわかるので設定しまして~(0.0333667 129というデータより)
cd 'D:\cloud\OneDrive\ドキュメント\東京理科大\物理学実験\単振動'
plotデータのあるパスに移動しまして~
fit f(x) 'Damped_oscillation.dat' via a, b
iter      chisq       delta/lim  lambda   a             b
   0 1.1500506471e+05  0.00e+00 7.93e+01  1.300000e+02 -1.464505e-02
   1 1.1807522983e+04 -8.74e+05 7.93e+00  7.702184e+01 -2.494400e-02
   2 1.9087684260e+03 -5.19e+05 7.93e-01  1.012543e+02 -6.646146e-02
   3 1.0879990850e+03 -7.54e+04 7.93e-02  1.138625e+02 -8.225259e-02
   4 1.0706006120e+03 -1.63e+03 7.93e-03  1.158679e+02 -8.465909e-02
   5 1.0703318517e+03 -2.51e+01 7.93e-04  1.160845e+02 -8.497840e-02
   6 1.0703282549e+03 -3.36e-01 7.93e-05  1.161116e+02 -8.502011e-02
iter      chisq       delta/lim  lambda   a             b

After 6 iterations the fit converged.
final sum of squares of residuals : 1070.33
rel. change during last iteration : -3.36052e-006

degrees of freedom    (FIT_NDF)                        : 28
rms of residuals      (FIT_STDFIT) = sqrt(WSSR/ndf)    : 6.18272
variance of residuals (reduced chisquare) = WSSR/ndf   : 38.226

Final set of parameters            Asymptotic Standard Error
=======================            ==========================
a               = 116.112          +/- 3.461        (2.981%)
b               = -0.0850201       +/- 0.004        (4.704%)

correlation matrix of the fit parameters:
                a      b
a               1.000
b              -0.746  1.000
fittingし ました!ちなみに-0.746ってのが相関係数rです。これを2乗すればExcelでおなじみ、R^2ですね。
参考サイト
- http://wwwal.kuicr.kyoto-u.ac.jp/www/accelerator/a4/gnuplot/fit.html
- http://esppro.mtk.nao.ac.jp/~kusakabe/gnuplotmemo.html
- http://physics.clarku.edu/sip/tutorials/gnuplot/
- http://hwb.ecc.u-tokyo.ac.jp/current/applications/gnuplot/fitting/
- http://detail.chiebukuro.yahoo.co.jp/qa/question_detail/q12153225342
- http://www.geisya.or.jp/~mwm48961/kou3/data_analysis3.htm
近似線のplot
色と凡例を変えます。sprintf関数なんてあるんだね。Cみたい。
plot f(x) lt 1 lc rgb '#000000' title sprintf("%fexp(%ft)", a, b)
参考サイト
- http://takeno.iee.niit.ac.jp/~foo/gp-jman/data/20080929/gnuplot-ja-div/node69.html
- http://www.deqnotes.net/gnuplot/labels
- http://d.hatena.ne.jp/yrgnah_yats/20090802/1249188972
- http://www.yulghun.com/docs/gnuplot/misc4.html (text encodeをISO-2022-JPに。)
- http://www.gnuplot-cmd.com/style/style-line.html
- http://stackoverflow.com/questions/19245135/point-color-in-gnuplot-4-0
データのplot
散布図を作ります。ただデフォルトだと気に喰わないのでオプションつけます。**プロットが丸印じゃないなんて!**あ、追記なのでplotじゃなくてreplotしてます。pt 6が丸印かどうかは環境による模様。
replot 'Damped_oscillation.dat' lt 1 lc rgb '#111111' pt 6
参考サイト
- http://dsl4.eee.u-ryukyu.ac.jp/DOCS/gnuplot/node90.html
- http://graph.pc-physics.com/replot1.html
- http://graph.pc-physics.com/fromfile.html
完成
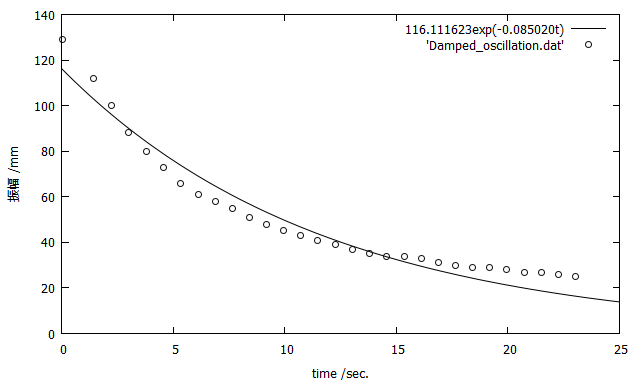
一応完成しまして~
fittingの調整
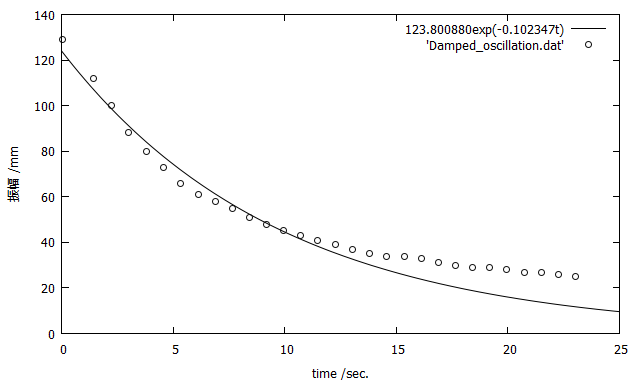
近似線が気に喰わないので、横軸0-15の範囲に収まるデータのみでfittingして再表示しまして~
fit [0:15] f(x) 'Damped_oscillation.dat' via a,b
plot f(x) lt 1 lc rgb '#000000' title sprintf("%fexp(%ft)", a, b)
replot 'Damped_oscillation.dat' lt 1 lc rgb '#111111' pt 6
今度こそ完成し ました!
コマンドだけ抜き出す
説明なんざいらね!って場合に。
set xlabel "time /sec."
set ylabel "振幅 /mm"
set xrange [0:25]
set yrange [0:140]
f(x)=a*exp(b*x)
a=130
cd 'D:\cloud\OneDrive\ドキュメント\東京理科大\物理学実験\単振動'
fit f(x) 'Damped_oscillation.dat' via a, b
plot f(x) lt 1 lc rgb '#000000' title sprintf("%fexp(%ft)", a, b)
replot 'Damped_oscillation.dat' lt 1 lc rgb '#111111' pt 6
破線を引く時
をみればいい。
plot g(x) lt 1 dt(10, 5) lc rgb '#000000' title sprintf("%fx+%f", a, b)
こんなことができる


