このページに記載のサンプルコードを例として参考にします。Leaflet.jsのヴァージョンが0.7.*以下の場合で有効な書き方です。
http://www.d3noob.org/2014/03/leaflet-map-with-d3js-elements-that-are.html
ライブラリファイルを読み込みます。
<link rel="stylesheet" href="//cdn.leafletjs.com/leaflet-0.7/leaflet.css" />
<script src="//cdn.leafletjs.com/leaflet-0.7/leaflet.js"></script>
<script src="//d3js.org/d3.v3.min.js"></script>
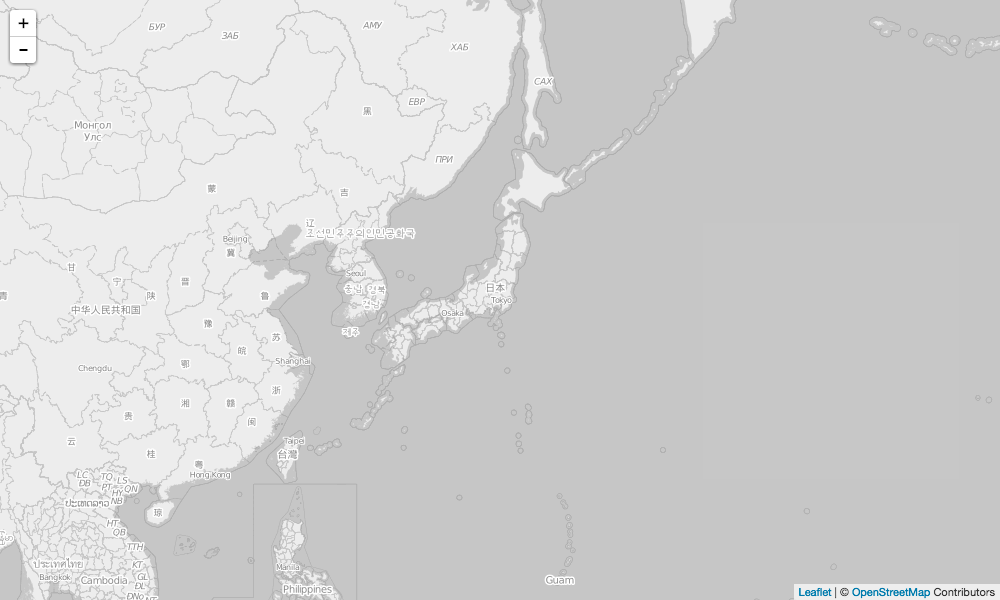
地図を描きます(例はOpenStreetMap)。
var map = L.map('map').setView([35.689488, 139.691706], 4);
mapLink = '<a href="http://openstreetmap.org">OpenStreetMap</a>';
L.tileLayer(
'http://{s}.www.toolserver.org/tiles/bw-mapnik/{z}/{x}/{y}.png', {
attribution: '© ' + mapLink + ' Contributors',
maxZoom: 18,
}).addTo(map);
map._initPathRoot();
地図が表示されました。
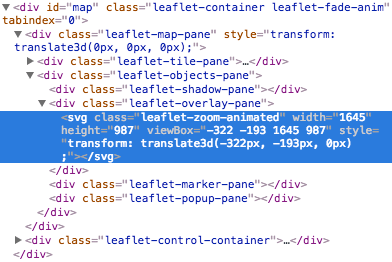
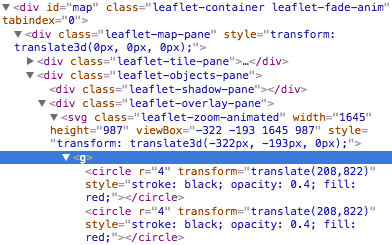
ChromeでDeveloper Toolsを立ち上げてみると、Leaflet.jsが生成したdivの中に、svgが生成されています。
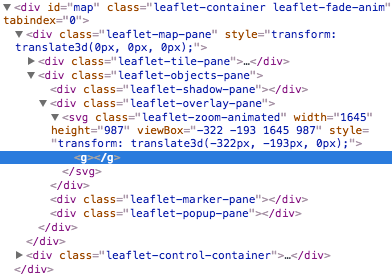
ここにd3.jsを使って、svg要素を追加していきます。まずは便利なのでグループ要素を生成します。
var g = d3.select("#map").select("svg").append("g");
svgの中にgroupが生成されました。
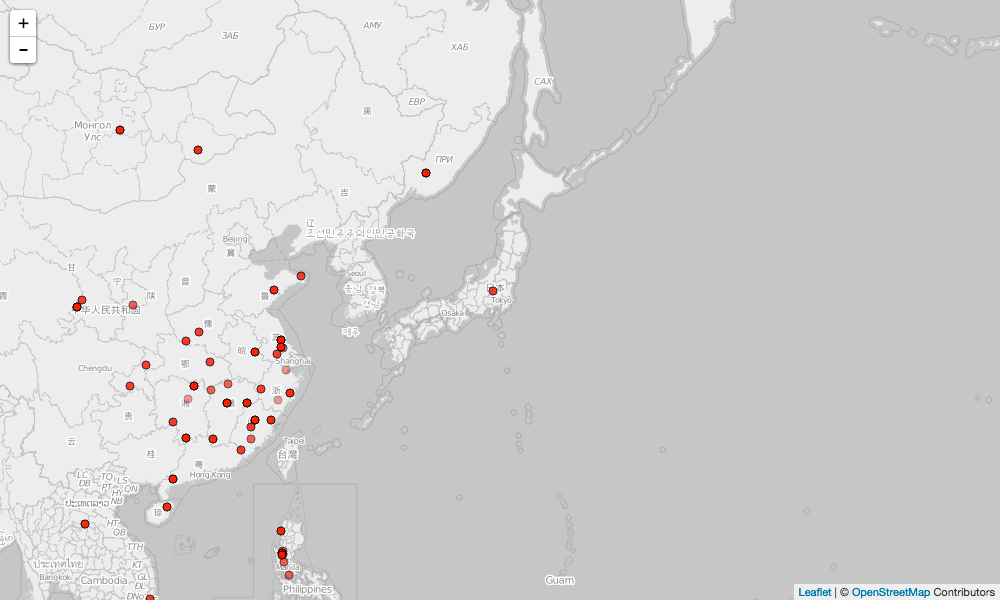
データを元にcircleを生成すると、
var feature = g.selectAll("circle")
    .data(collection.objects)
    .enter().append("circle")
    .style("stroke", "black")
    .style("opacity", .4)
    .style("fill", "red")
    .attr("r", 4);
groupの中にcicleが生成されました。
あとはviewreset時に、生成したグループの位置合わせをするようにlatLngToLayerPointを使った設定をしておきます。
http://leafletjs.com/reference.html#map-viewreset
map.on("viewreset", update);
update();

function update() {
  feature.attr("transform",
  function(d) {
    return "translate("+
      map.latLngToLayerPoint(d.LatLng).x +","+
      map.latLngToLayerPoint(d.LatLng).y +")";
    }
  )
}
