Python標準にも random というモジュールがあるが、ベクトル演算の可能な numpy のほうが「大量に乱数を生成してなんかの処理をする」という場合に高速に動く。あと分布関数が山ほど用意されている。
一様乱数
numpy.random.rand() で 0〜1 の一様乱数を生成する。引数を指定すれば複数の乱数を生成できる。乱数の範囲を変えたい場合は後からベクトル演算をすれば良い。
from numpy.random import *

rand()		# 0〜1の乱数を1個生成
rand(100)	# 0〜1の乱数を100個生成
rand(10,10)	# 0〜1の乱数で 10x10 の行列を生成

rand(100) * 40 + 30	# 30〜70の乱数を100個生成
特定の分布関数に従う乱数
どれも size=(10,10) などと引数を指定すれば、任意の個数の乱数を生成できる。
from numpy.random import *

""" 標準正規分布。いわゆるガウシアン。標準正規分布ならば randn() で、平均・分散を指定したい場合は normal() を用いる。"""
randn()			# 標準正規分布 (平均0, 標準偏差1)
randn(10)		# 標準正規分布を10個生成
randn(10,10)	# 標準正規分布による 10x10 の行列

normal(50,10)	# 平均50、標準偏差10の正規分布

""" 二項分布。確率pでオモテが出るコインをn回投げて、オモテが出る個数。 """
binomial(n=100, p=0.5)

""" ポアソン分布。稀にしか起きない現象を長時間観測したときに起きる回数の分布。λはその平均。 """
poisson(lam=10)		# λ=10 のポアソン分布

""" ベータ分布。二項分布の共役事前分布などに用いる。"""
beta(a=3, b=5)		# a=3, b=5 のベータ分布
他にもχ分布、ディリクレ分布、指数分布、F分布、ガンマ分布、幾何分布、ガンベル分布、超幾何分布、ラプラス分布、ロジスティック分布、対数正規分布... など山ほどある。詳しくはこのへんを参照。
http://docs.scipy.org/doc/numpy/reference/routines.random.html
整数
from numpy.random import *

randint(100)			#  0〜99 の整数を1個生成
randint(30,70)			# 30〜69 の整数を1個生成
randint(0,100,20)		#  0〜99 の整数を20個生成
randint(0,100,(5,5))	#  0〜99 の整数で5x5の行列を生成

random_integers(100)	# 1〜100 の整数を1個生成
random_integers(30,70)	# 30〜70 の整数を1個生成
リストからのランダム抽出
from numpy import *

city = ["Sapporo","Sendai","Tokyo","Nagoya","Kyoto","Osaka","Fukuoka"]

random.choice(city)						# 1個をランダム抽出
random.choice(city,10)					# 10個をランダム抽出(重複あり)
random.choice(city,5,replace=False)	# 5個をランダム抽出(重複なし)

# 確率を重み付けする場合
weight = [0.1, 0.1, 0.3, 0.1, 0.1, 0.2, 0.1]
random.choice(city, p=weight)			# 指定した確率で1個を抽出
乱数発生の初期化
Numpyで生成される乱数は擬似乱数であるため、固定したseedを指定してやれば毎回同じ乱数が出る。デバッグ時など毎回同じ乱数を出して欲しいときに使う。
from numpy.random import *

seed(100)		# 数値はなんでもいい
rand()			# 毎回同じ値を返す
分布をヒストグラムで確認
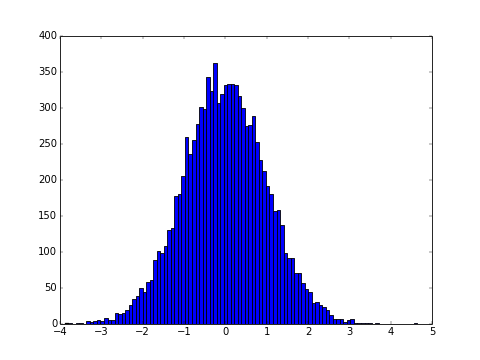
目的どおりの乱数が生成しているか不安な場合は、大量に乱数を生成してヒストグラムを描写すると良い。ここでは matplotlib というグラフ描写モジュールを用いる。
from numpy.random import *
import matplotlib.pyplot as plt

R = randn(10000)		# 標準正規分布で乱数を1万個生成
plt.hist(R, bins=100)	# 100本のヒストグラムを作成
plt.show()				# グラフを表示
応用: ランダムウォークの生成
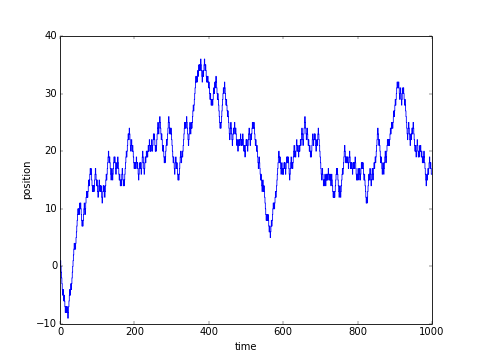
右か左、つまり +1 か -1 の乱数列を生成し、その累積和 cumsum() をとる。
from numpy import *

L = 1000							# 歩数
step = random.choice([-1,1],L)	 	# +1 or -1 をL個生成
position = cumsum(step)				# 位置の変化

