今日は昨日に引き続き SciPy and NumPy
Optimizing & Boosting your Python Programming の中から scikit-learn を使った例を軽く説明します。クラスタリングについてはすでに食べられるキノコを見分けるやクラスタリングの結果を再利用するといった記事で説明しましたし scikit-learn によるクラスタリング
でも取り扱ってきましたから機械学習の中でもすっかりお馴染みの手法かと思います。
scikit-learn でのクラスタリング
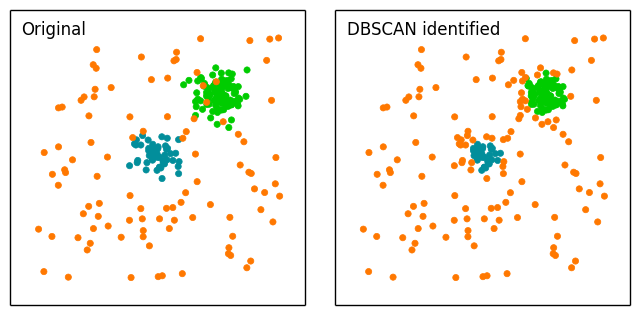
ポピュラーな kmeans と比較して多くのデータ点を有するコア点を見つける DBSCAN アルゴリズムは、コアが定義されると指定された半径内内でプロセスは反復します。ノイズを多く含むデータに対して、しばしば kmeans と比較される手法です。
原著においてもこれらの手法を比較し可視化しています。さっそく試してみましょう。
import numpy as np
import matplotlib.pyplot as mpl
from scipy.spatial import distance
from sklearn.cluster import DBSCAN

# まずはサンプルデータを乱数で生成します
c1 = np.random.randn(100, 2) + 5
c2 = np.random.randn(50, 2)

# 均一分布を生成、積み上げる
u1 = np.random.uniform(low=-10, high=10, size=100)
u2 = np.random.uniform(low=-10, high=10, size=100)
c3 = np.column_stack([u1, u2])

# 150 x 2 の配列にすべてのデータをためこむ
data = np.vstack([c1, c2, c3])

# DBSCAN を利用したクラスタリング
# db.labels_ はデータ内の異なるクラスタへの識別子を持つ配列です
db = DBSCAN().fit(data)
labels = db.labels_

# それぞれのコアに対する座標を取得します
# 2 つのクラスタは 0 と 1 として、ノイズは -1 と分類されます
# これらを分割します
dbc1 = data[labels == 0] # 負例
dbc2 = data[labels == 1] # 正例
noise = data[labels == -1] # ノイズ
このようにノイズを取り分けることができるのが特徴です。
可視化
おなじみの matplotlib で可視化しましょう。
x1, x2 = -12, 12
y1, y2 = -12, 12
fig = mpl.figure()
fig.subplots_adjust(hspace=0.1, wspace=0.1)
ax1 = fig.add_subplot(121, aspect='equal')
ax1.scatter(c1[:, 0], c1[:, 1], lw=0.5, color='#00CC00')
ax1.scatter(c2[:, 0], c2[:, 1], lw=0.5, color='#028E9B')
ax1.scatter(c3[:, 0], c3[:, 1], lw=0.5, color='#FF7800')
ax1.xaxis.set_visible(False)
ax1.yaxis.set_visible(False)
ax1.set_xlim(x1, x2)
ax1.set_ylim(y1, y2)
ax1.text(-11, 10, 'Original')
ax2 = fig.add_subplot(122, aspect='equal')
ax2.scatter(dbc1[:, 0], dbc1[:, 1], lw=0.5, color='#00CC00')
ax2.scatter(dbc2[:, 0], dbc2[:, 1], lw=0.5, color='#028E9B')
ax2.scatter(noise[:, 0], noise[:, 1], lw=0.5, color='#FF7800')
ax2.xaxis.set_visible(False)
ax2.yaxis.set_visible(False)
ax2.set_xlim(x1, x2)
ax2.set_ylim(y1, y2)
ax2.text(-11, 10, 'DBSCAN identified')
fig.savefig('image.png', bbox_inches='tight')
