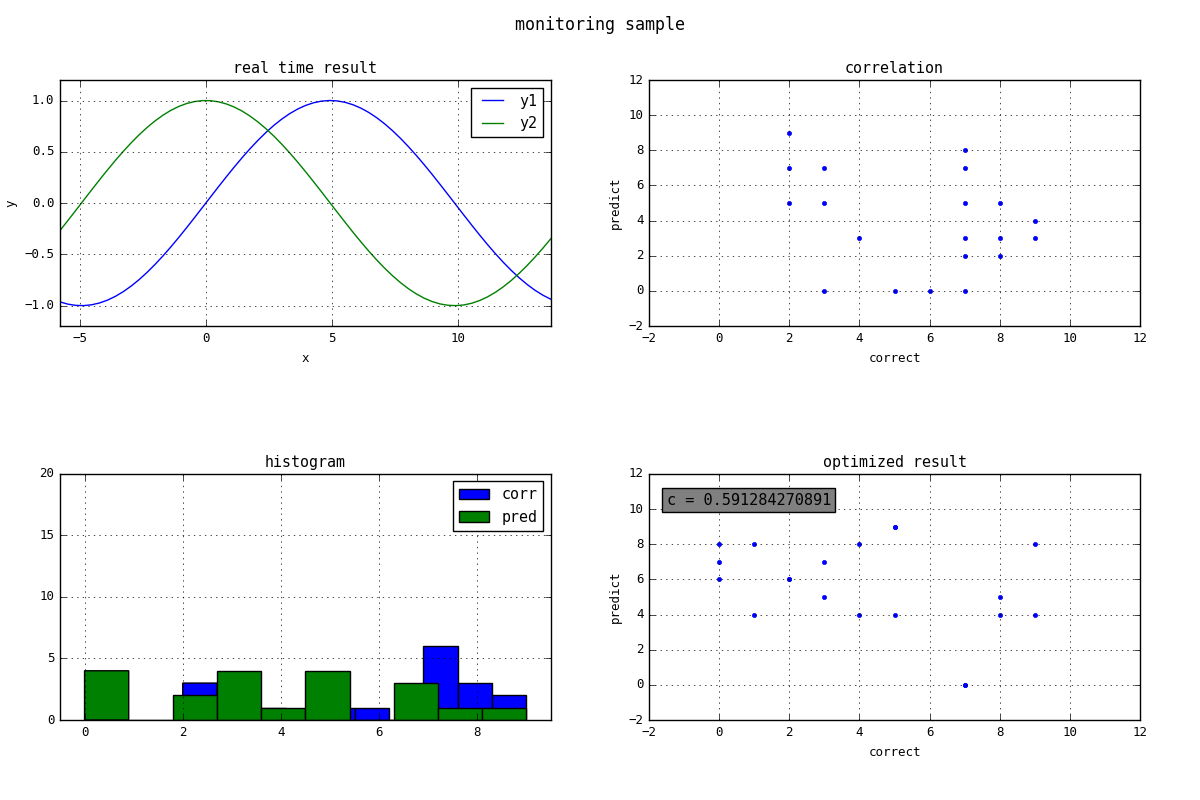
モニタリング
モデルのパラメータチューニングを行う場合など,グラフに出して学習経過をリアルタイムで観察すると作業が捗ります.
クライアントマシンで計算流しているときに,GPUリソースが足りずにtensorboardが表示できなかった時に作ったスクリプトを紹介します.
別スクリプトで使う場合には,import realtime_plotで読み込んで,realtime_plotをクラス宣言してもらえればそのまま使用できます.
realtime_plot.py
import numpy as np
import matplotlib as mpl
import matplotlib.pyplot as plt

# matplotlibのデフォルト設定の変更
font = {'family':'monospace', 'size':'9'}
mpl.rc('font', **font)

class realtime_plot(object):

    def __init__(self):
        self.fig = plt.figure(figsize=(12,8))
        self.initialize()

    def initialize(self):
        self.fig.suptitle('monitoring sample', size=12)
        self.fig.subplots_adjust(left=0.05, bottom=0.1, right=0.95, top=0.90, wspace=0.2, hspace=0.6)
        self.ax00 = plt.subplot2grid((2,2),(0,0))
        self.ax10 = plt.subplot2grid((2,2),(1,0))
        self.ax01 = plt.subplot2grid((2,2),(0,1))
        self.ax11 = plt.subplot2grid((2,2),(1,1))
        self.ax00.grid(True)
        self.ax10.grid(True)
        self.ax01.grid(True)
        self.ax11.grid(True)
        self.ax00.set_title('real time result')
        self.ax10.set_title('histogram')
        self.ax01.set_title('correlation')
        self.ax11.set_title('optimized result')
        self.ax00.set_xlabel('x')
        self.ax00.set_ylabel('y')
        self.ax01.set_xlabel('correct')
        self.ax01.set_ylabel('predict')
        self.ax11.set_xlabel('correct')
        self.ax11.set_ylabel('predict')

        # プロットの初期化
        self.lines000, = self.ax00.plot([-1,-1],[1,1],label='y1')
        self.lines001, = self.ax00.plot([-1,-1],[1,1],label='y2')
        self.lines100 = self.ax10.hist([-1,-1],label='res1')
        self.lines101 = self.ax10.hist([-1,-1],label='res2')
        self.lines01, = self.ax01.plot([-1,-1],[1,1],'.')
        self.lines11, = self.ax11.plot([-1,-1],[1,1],'.r')

    # 値名と値を代入した辞書タイプのdataから,必要なデータをsubplotの値に代入します
    def set_data(self,data):

        self.lines000.set_data(data['x'],data['y1'])
        self.lines001.set_data(data['x'],data['y2'])
        self.ax00.set_xlim((data['x'].min(),data['x'].max()))
        self.ax00.set_ylim((-1.2,1.2))
        # 凡例を固定するために必要
        self.ax00.legend(loc='upper right')

        self.lines01.set_data(data['corr'],data['pred'])
        self.ax01.set_xlim((-2,12))
        self.ax01.set_ylim((-2,12))

        # ヒストグラムはset_dataがないので,更新毎に新たに作り直します
        self.ax10.cla()
        self.ax10.set_title('histogram')
        self.ax10.grid(True)
        self.lines100 = self.ax10.hist(data['corr'],label='corr')
        self.lines101 = self.ax10.hist(data['pred'],label='pred')
        self.ax10.set_xlim((-0.5,9.5))
        self.ax10.set_ylim((0,20))
        self.ax10.legend(loc='upper right')

        # タイトルやテキストを更新する場合,更新前の値がfigureに残ったままになるので,更新毎に新たに作り直します
        bbox_props = dict(boxstyle='square,pad=0.3',fc='gray')
        self.ax11.cla()
        self.ax11.grid(True)
        self.ax11.set_xlabel('correct')
        self.ax11.set_ylabel('predict')
        self.ax11.set_title('optimized result')
        self.ax11.text(-1.5,10.5,data['text'], ha='left', va='center',size=11,bbox=bbox_props)
        self.lines = self.ax11.plot(data['opt_corr'],data['opt_pred'],'.')
        self.ax11.set_xlim((-2,12))
        self.ax11.set_ylim((-2,12))

    def pause(self,second):
        plt.pause(second)

# 使用例
RP = realtime_plot()
data = {}
x = np.arange(-np.pi,np.pi,0.1)
y1 = np.sin(x)
y2 = np.cos(x)
opt_coef = 0

while True:
    x += 0.1
    y1 = np.sin(x)
    y2 = np.cos(x)
    corr = np.random.randint(0,10,20)
    pred = np.random.randint(0,10,20)
    c = np.random.normal(0,1,1)

    data['x'] = np.pi * x
    data['y1'] = y1
    data['y2'] = y2
    data['corr'] = corr
    data['pred'] = pred
    coef = np.corrcoef(c*corr,pred)[0,1]

    if abs(coef) > abs(opt_coef):
        data['opt_corr'] = corr
        data['opt_pred'] = pred
        data['text'] = 'c = ' + str(c[0])
        opt_coef = coef

    RP.set_data(data)
    RP.pause(0.1)
サンプル