fluentd+dstat+InfluxDB v0.9.x+Grafanaでの、サーバのメトリクスの可視化について書きます。
用意するもの
- fluentd (v0.12以降)
- fluent-plugin-dstat
- fluent-plugin-filter-object-flatten
- fluent-plugin-filter-record-map
- Rinflux
- fluent-plugin-rinflux
- InfluxDB v0.9.x
- Grafana v2.0.2
作業手順
InfluxDBのセットアップ
wget http://s3.amazonaws.com/influxdb/influxdb_latest_amd64.deb
sudo dpkg -i influxdb_latest_amd64.deb
sudo service influxdb start
databaseの作成
InfluxDBの管理画面(localhost:8083)から以下のクエリを実行して、あらかじめデータベースを作成しておきます。
CREATE DATABASE mydb
Grafanaのセットアップ
wget https://grafanarel.s3.amazonaws.com/builds/grafana_2.0.2_amd64.deb
sudo apt-get install -y adduser libfontconfig
sudo dpkg -i grafana_2.0.2_amd64.deb
Rinflux/fluent-plugin-rinflux
InfluxDB公式のRubyライブラリはv0.9.0に対応中のステータスで、fluentdプラグインも含め、InfluxDB v0.9.xではまだ使えない状態です(2015/07/18現在)
※v0.2.0が出たようです
なので、とりあえずv0.9.x対応のInfluxDBクライアントとfluentdのプラグインを自作しました。本家の対応状況を鑑みてrubygems.orgには登録していません。従って、git cloneしてインストールする必要があります。
# install rinflux
git clone https://github.com/winebarrel/rinflux.git
cd rinflux
bundle install
bundle exec rake install

cd ..

# install fluent-plugin-rinflux
git clone https://github.com/winebarrel/fluent-plugin-rinflux.git
cd fluent-plugin-rinflux
bundle install
bundle exec rake install
fluent.conf
dstatメトリクスの収集までは以下のエントリと同じです。
fluent.confは以下のようになります。
<source>
  type dstat
  tag dstat.${hostname}
  option -clmdrn --freespace
  delay 3
</source>

<filter>
  type object_flatten
  separator _
  tr [" /", "__"]
</filter>

<filter>
  type grep
  exclude1 hostname .+
</filter>

<filter>
  type record_map
  map1 record.each {|k, v| new_record[k] = v.to_f }
</filter>

<match dstat.**>
  type rinflux
  db mydb
  flush_interval 1s
</match>
InfluxDBに流れるレコードは以下のような感じです。
{"dstat_net_total_send":1138.667}
{"dstat___used":3879976960.0}
{"dstat___free":38361186304.0}
{"dstat__dev_used":12288.0}
{"dstat__dev_free":251576320.0}
{"dstat__run_used":360448.0}
{"dstat__run_free":51019776.0}
{"dstat__rpc_pipefs_used":0.0}
{"dstat__rpc_pipefs_free":0.0}
{"dstat__systemd_used":0.0}
{"dstat__systemd_free":0.0}
{"dstat__vagrant_used":68592746496.0}
{"dstat__vagrant_free":430489739264.0}
{"dstat_total_cpu_usage_usr":0.0}
{"dstat_total_cpu_usage_sys":0.667}
{"dstat_total_cpu_usage_idl":99.333}
{"dstat_total_cpu_usage.wai":0.0}
Grapanaにデータソースを追加
管理ユーザ(admin/admin)でログインして、データソースを追加します。
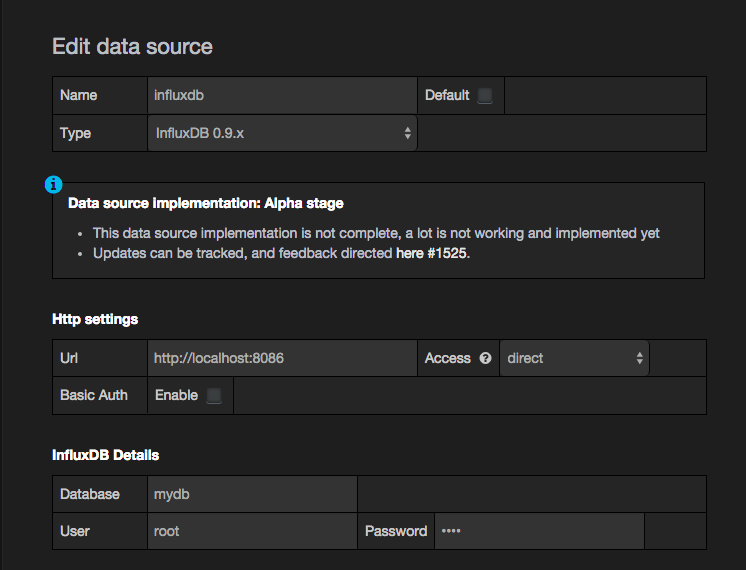
まだアルファ版とのこと。
Data source implementation: Alpha stage

This data source implementation is not complete, a lot is not working and implemented yet
Updates can be tracked, and feedback directed here #1525.
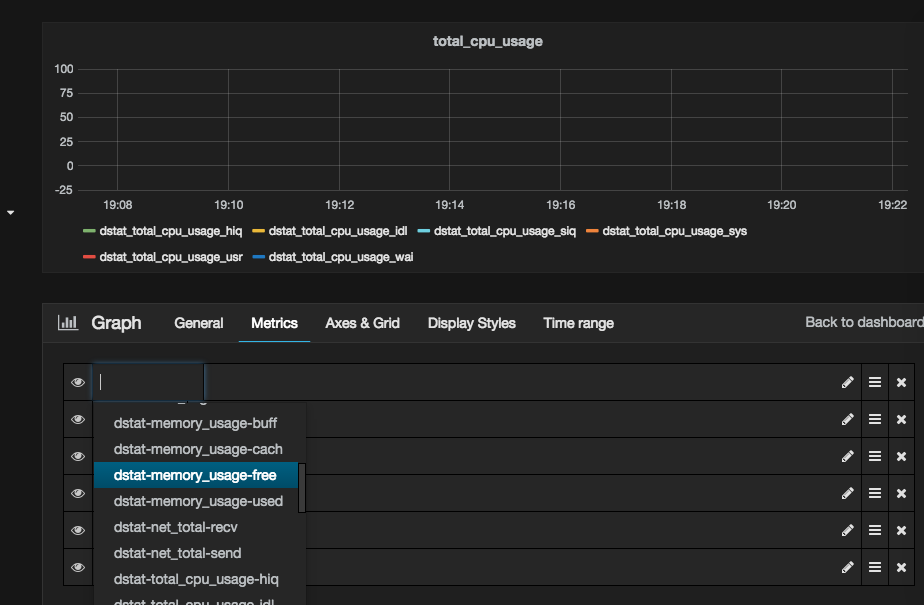
Grapanaにグラフを追加
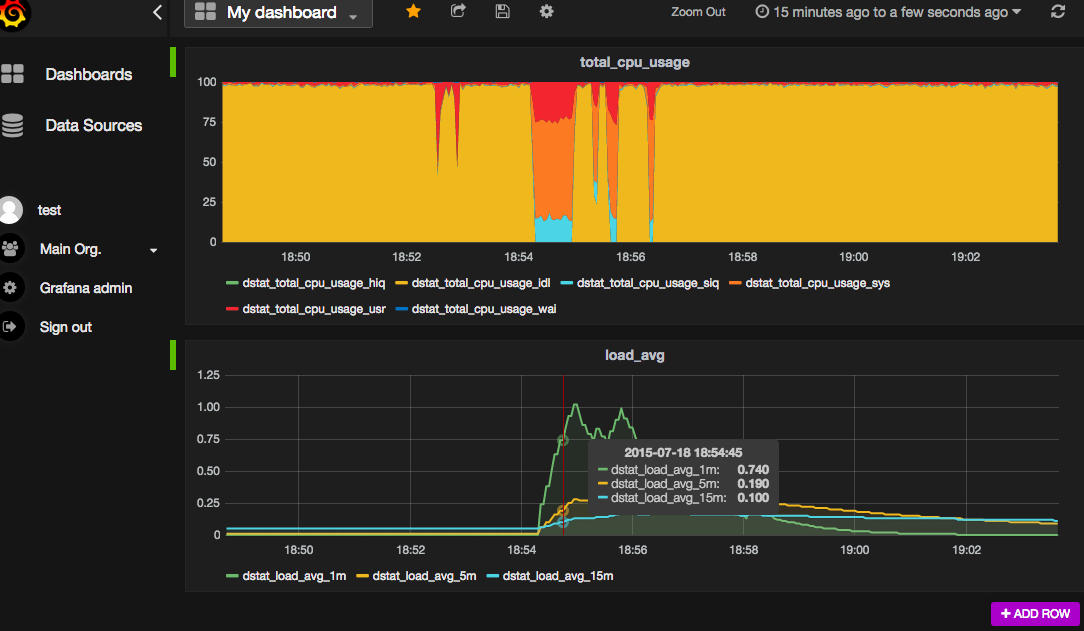
Grapanaに適当にダッシュボードを作って、グラフを追加します。
グラフを追加すると以下のようなダッシュボードが作れます。