Pythonで3次元グラフの描画
なんかいい感じに3次元のグラフを書いてほしいと要望があり,「いい感じに書くにはどうしたらええんや・・・」と調べたら,Pythonのmatplotlibで描画できると出てきました.
なので,今回はPythonのインストールから3次元グラフを描画するまでを書きます.
Python2.7インストール
インストールについては,たくさんの記事があるので,割愛します.
僕は,以下を参照して入れました.
ただ,Windows 10が悪いのか自分のPCが悪いのか,環境変数にPythonのPathが通らないので,以下のパスを追加します.
C:\\Python27
pipのインストール
いつの間にか超かんたんになってました!
以下のサイトに行って,「get-pip.py」をダウンロードして実行するだけで入ります.
コマンドプロンプトを起動して,get-pip.pyをダウンロードした場所に移動して,以下のコマンドで実行するとpipが入ります.
python get-pip.py
必要なもののインストール
データ整理用にnumpyと描画用にmatplotlibをインストールします.
python -m pip install numpy
python -m pip install matplotlib
これで,準備ができました.
描画プログラム
描画プログラムは以下のサイトを参考にさせていただきました.
matplotlibで3Dグラフを描画する
from mpl_toolkits.mplot3d import Axes3D
import matplotlib.pyplot as plt
import numpy as np

#範囲と間隔の設定
x = np.arange(-5, 5, 0.25)
y = np.arange(-5, 5, 0.25)

#メッシュ描画設定
X, Y = np.meshgrid(x, y)

#計算
Z = np.sin(X)+ np.cos(Y)

fig = plt.figure()
ax = Axes3D(fig)

#プロット
ax.plot_wireframe(X,Y,Z)

plt.show()
実行結果
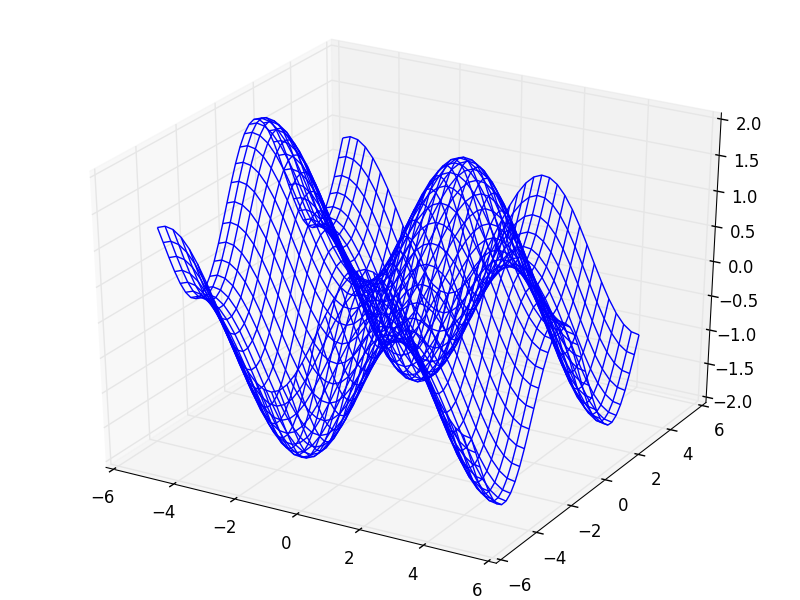
ここまでできれば,あとはnumpyの扱いさえ覚えればいけそう・・・かな?
なんとか3次元描画の方法がわかったので,これにOpenCVで処理した結果をプロットするために奮闘中です.