rvestというwebスクレイピングを簡単にやってくれるパッケージが便利ですわ、という話。さすが羽鳥氏の作りしパッケージ...。
このパッケージを使って、Rのカラーパレットを生成してみました。
今回はDribbbleというおしゃれなイラストが投稿されるサイトから、投稿画像で使われているカラーパレットを取得します。
例えばこのページだと、ほぼピンクです。合わせて4色が使われているみたいです。
パッケージはrvestとパイプ演算子を使用するためにmagrittr、デモ用にggplot2を使用します。インストールしていない人はインストールしてください
# 上記パッケージをインストールしていない場合...
library(devtools)
install_github("hadley/rvest")     #https://github.com/hadley/rvest
install_github("smbache/magrittr") #https://github.com/smbache/magrittr
URLを指定
get_palette <- function (url, col.n = 8) {
  url <- html(url)
  cols <- url %>%
    html_nodes("ul.color-chips li a") %>%
    html_attr("title")

  cols[1:col.n]
  na.omit(cols)
}
# 'usage
# get_palette(url = "https://dribbble.com/shots/1617296-Dribbble-is-5")
カテゴリーから取得
get_shot_palette <- function (col.n = 8, genre = c("debut", "recent", "teams", "playoffs", "animated")) {
  base.url <- c("https://dribbble.com")

  request.url <- html(paste(base.url, "/shots?list=", genre, sep = "")) %>%
    html_nodes(".dribbble-img a") %>%
    html_attr("href") %>%
    head(1)

  request.url <-paste(base.url, request.url, sep = "")

  url <- html(request.url)
  cols <- url %>%
    html_nodes("ul.color-chips li a") %>%
    html_attr("title")

  cols[1:col.n]
  na.omit(cols)
}
# 'usage
# get_shot_palette(genre = "debut")
カラーパレットの使用
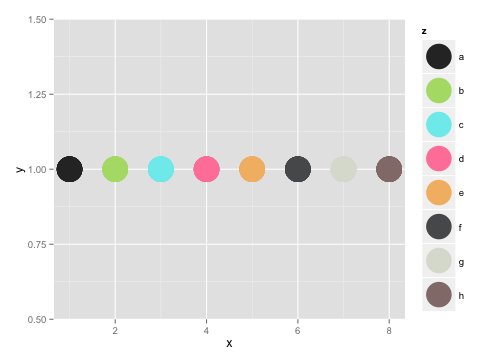
取得したカラーパレットをもとに作図をしてみます。
my.col <- get_shot_palette(genre = "animated")
my.col
[1] "#2F2F2F" "#B1DC76" "#7BECED" "#FF85A7"
[5] "#F3BB72" "#57595B" "#DBDFD4" "#927C78"

library(ggplot2)

x <- c(1:8)
y <- rep(1, 8)

z <- c(letters[1:8])
xyz <- merge(x, y) %>%
  cbind(z)

ggplot(data = xyz,
       aes(x = x, y = y)) +
  geom_point(size = 12, aes(color = z)) +
  scale_colour_manual(values = my.col)
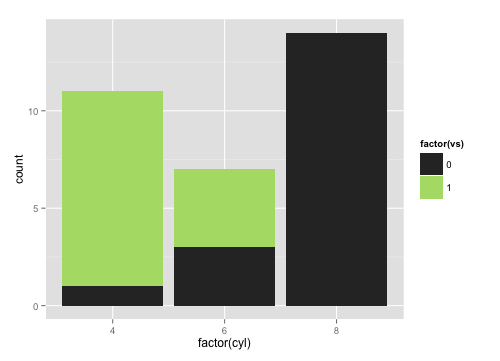
qplot(factor(cyl), data=mtcars, geom="bar", fill=factor(vs)) +
  scale_fill_manual(values = my.col)
おわりに
デザインに関わる人が考えた色使いなので綺麗ですね。他にもカラーパレットが作れそうなwebサイトがありましたら教えてほしいです。HTML中にカラーコードを出力しているのが良いです...。

