PythonでFXシストレのバックテスト(1)
の続きです。
(1)でバックテスト可能なシステムは、確定した終値から生成したシグナルに対して、次のバーの始値で成行き売買を行うもののみでした。今回は、指値売買やオープンポジションの損益から利食いや損切りを行うシステムまで拡張してみました。
全体の流れは(1)と同じです。共通部分は簡単に書いておくので、詳しくは(1)の記事を参照してください。
4本値データの作成
2015年におけるEUR/USD、1時間足の4本値データをohlcとして作っておきます。
import numpy as np
import pandas as pd
import indicators as ind #indicators.pyのインポート

dataM1 = pd.read_csv('DAT_ASCII_EURUSD_M1_2015.csv', sep=';',
                     names=('Time','Open','High','Low','Close', ''),
                     index_col='Time', parse_dates=True)
dataM1.index += pd.offsets.Hour(7) #7時間のオフセット
ohlc = ind.TF_ohlc(dataM1, 'H') #1時間足データの作成
売買シグナルの作成
バックテストさせるシステムの売買シグナルを作成します。今回は、エントリーは移動平均の交差、エグジットは移動平均と終値の交差とします。
利用するテクニカル指標は、エントリー用の移動平均が二つ、エグジット用の移動平均が一つです。
FastMA = ind.iMA(ohlc, 10) #エントリー用短期移動平均
SlowMA = ind.iMA(ohlc, 30) #エントリー用長期移動平均
ExitMA = ind.iMA(ohlc, 5) #エグジット用移動平均
これらの指標値を使って売買シグナルを作成します。
# 買いエントリーシグナル
BuyEntry = ((FastMA > SlowMA) & (FastMA.shift() <= SlowMA.shift())).values
# 売りエントリーシグナル
SellEntry = ((FastMA < SlowMA) & (FastMA.shift() >= SlowMA.shift())).values
# 買いエグジットシグナル
BuyExit = ((ohlc.Close < ExitMA) & (ohlc.Close.shift() >= ExitMA.shift())).values
# 売りエグジットシグナル
SellExit = ((ohlc.Close > ExitMA) & (ohlc.Close.shift() <= ExitMA.shift())).values
これらのシグナルは、交差の条件を満たすすべての位置で生成されますが、実際にはポジションの有無によって採用されないものもあります。そのあたりの制御は、以下のバックテスト関数で行います。
バックテスト関数の作成
今回、システムの売買ルールの拡張として対応させたのは、以下の2点です。
- エントリーシグナル発生時の価格に対して、一定pipsだけ離れた指値を指定して、その価格に達したときに約定する。
- オープンしたポジションが一定pipsの利益、あるいは損失に達したら決済する。
そのため、関数の引数を以下のように増やしました。
def Backtest(ohlc, BuyEntry, SellEntry, BuyExit, SellExit, lots=0.1, spread=2, TP=0, SL=0, Limit=0, Expiration=10):
このなかのLimitに正の値を代入すると、エントリーシグナルですぐに売買せずに、買いの場合、Limitpips分安い指値、売りの場合、Limitpips分高い指値を指します。Expirationは指値の有効期間でバーの本数で指定します。
TPとSLはそれぞれ利食いのための利益(pips)、損切りのための損失(pips)を表します。正の値を代入することで機能します。
関数の全体は以下のようになります。
def Backtest(ohlc, BuyEntry, SellEntry, BuyExit, SellExit, lots=0.1, spread=2, TP=0, SL=0, Limit=0, Expiration=10):
    Open = ohlc.Open.values #始値
    Low = ohlc.Low.values #安値
    High = ohlc.High.values #高値
    Point = 0.0001 #1pipの値
    if(Open[0] > 50): Point = 0.01 #クロス円の1pipの値
    Spread = spread*Point #スプレッド
    Lots = lots*100000 #実際の売買量
    N = len(ohlc) #FXデータのサイズ

    LongTrade = np.zeros(N) #買いトレード情報
    ShortTrade = np.zeros(N) #売りトレード情報

    #買いエントリー価格
    BuyEntryS = np.hstack((False, BuyEntry[:-1])) #買いエントリーシグナルのシフト
    if Limit == 0: LongTrade[BuyEntryS] = Open[BuyEntryS]+Spread #成行買い
    else: #指値買い
        for i in range(N-Expiration):
            if BuyEntryS[i]:
                BuyLimit = Open[i]-Limit*Point #指値
                for j in range(Expiration):
                    if Low[i+j] <= BuyLimit: #約定条件
                        LongTrade[i+j] = BuyLimit+Spread
                        break
    #買いエグジット価格
    BuyExitS = np.hstack((False, BuyExit[:-2], True)) #買いエグジットシグナルのシフト
    LongTrade[BuyExitS] = -Open[BuyExitS]

    #売りエントリー価格
    SellEntryS = np.hstack((False, SellEntry[:-1])) #売りエントリーシグナルのシフト
    if Limit == 0: ShortTrade[SellEntryS] = Open[SellEntryS] #成行売り
    else: #指値売り
        for i in range(N-Expiration):
            if SellEntryS[i]:
                SellLimit = Open[i]+Limit*Point #指値
                for j in range(Expiration):
                    if High[i+j] >= SellLimit: #約定条件
                        ShortTrade[i+j] = SellLimit
                        break
    #売りエグジット価格
    SellExitS = np.hstack((False, SellExit[:-2], True)) #売りエグジットシグナルのシフト
    ShortTrade[SellExitS] = -(Open[SellExitS]+Spread)

    LongPL = np.zeros(N) # 買いポジションの損益
    ShortPL = np.zeros(N) # 売りポジションの損益
    BuyPrice = SellPrice = 0.0 # 売買価格

    for i in range(1,N):
        if LongTrade[i] > 0: #買いエントリーシグナル
            if BuyPrice == 0:
                BuyPrice = LongTrade[i]
                ShortTrade[i] = -BuyPrice #売りエグジット
            else: LongTrade[i] = 0

        if ShortTrade[i] > 0: #売りエントリーシグナル
            if SellPrice == 0:
                SellPrice = ShortTrade[i]
                LongTrade[i] = -SellPrice #買いエグジット
            else: ShortTrade[i] = 0

        if LongTrade[i] < 0: #買いエグジットシグナル
            if BuyPrice != 0:
                LongPL[i] = -(BuyPrice+LongTrade[i])*Lots #損益確定
                BuyPrice = 0
            else: LongTrade[i] = 0

        if ShortTrade[i] < 0: #売りエグジットシグナル
            if SellPrice != 0:
                ShortPL[i] = (SellPrice+ShortTrade[i])*Lots #損益確定
                SellPrice = 0
            else: ShortTrade[i] = 0

        if BuyPrice != 0 and SL > 0: #SLによる買いポジションの決済
            StopPrice = BuyPrice-SL*Point
            if Low[i] <= StopPrice:
                LongTrade[i] = -StopPrice
                LongPL[i] = -(BuyPrice+LongTrade[i])*Lots #損益確定
                BuyPrice = 0

        if BuyPrice != 0 and TP > 0: #TPによる買いポジションの決済
            LimitPrice = BuyPrice+TP*Point
            if High[i] >= LimitPrice:
                LongTrade[i] = -LimitPrice
                LongPL[i] = -(BuyPrice+LongTrade[i])*Lots #損益確定
                BuyPrice = 0

        if SellPrice != 0 and SL > 0: #SLによる売りポジションの決済
            StopPrice = SellPrice+SL*Point
            if High[i]+Spread >= StopPrice:
                ShortTrade[i] = -StopPrice
                ShortPL[i] = (SellPrice+ShortTrade[i])*Lots #損益確定
                SellPrice = 0

        if SellPrice != 0 and TP > 0: #TPによる売りポジションの決済
            LimitPrice = SellPrice-TP*Point
            if Low[i]+Spread <= LimitPrice:
                ShortTrade[i] = -LimitPrice
                ShortPL[i] = (SellPrice+ShortTrade[i])*Lots #損益確定
                SellPrice = 0

    return pd.DataFrame({'Long':LongTrade, 'Short':ShortTrade}, index=ohlc.index),\
            pd.DataFrame({'Long':LongPL, 'Short':ShortPL}, index=ohlc.index)
結構長くなってしまいましたが、簡単に説明すると、まずは、以下のようにシグナルの前処理をします。
- 各シグナル
BuyEntry,SellEntry,BuyExit,SellExitを1サンプルシフトして、BuyEntryS,SellEntryS,BuyExitS,SellExitSとします。実際に売買が行われるバーにシグナルが表れるようにするためです。 -
LongTrade,ShortTradeに、シグナル時に売買される価格を代入します。エントリーは正数、エグジットは負数とし、指値売買の場合は、有効期間で最初に指値に到達したバーの位置に売買価格が入ります。
その後、バーを最初から最後まで回していき、ポジションの有無やポジションの損益を見ながら売買や決済の処理を行います。LongTrade, ShortTrade に実際に売買した価格、LongPL,ShortPLに確定した損益を戻します。
バックテストの実行例
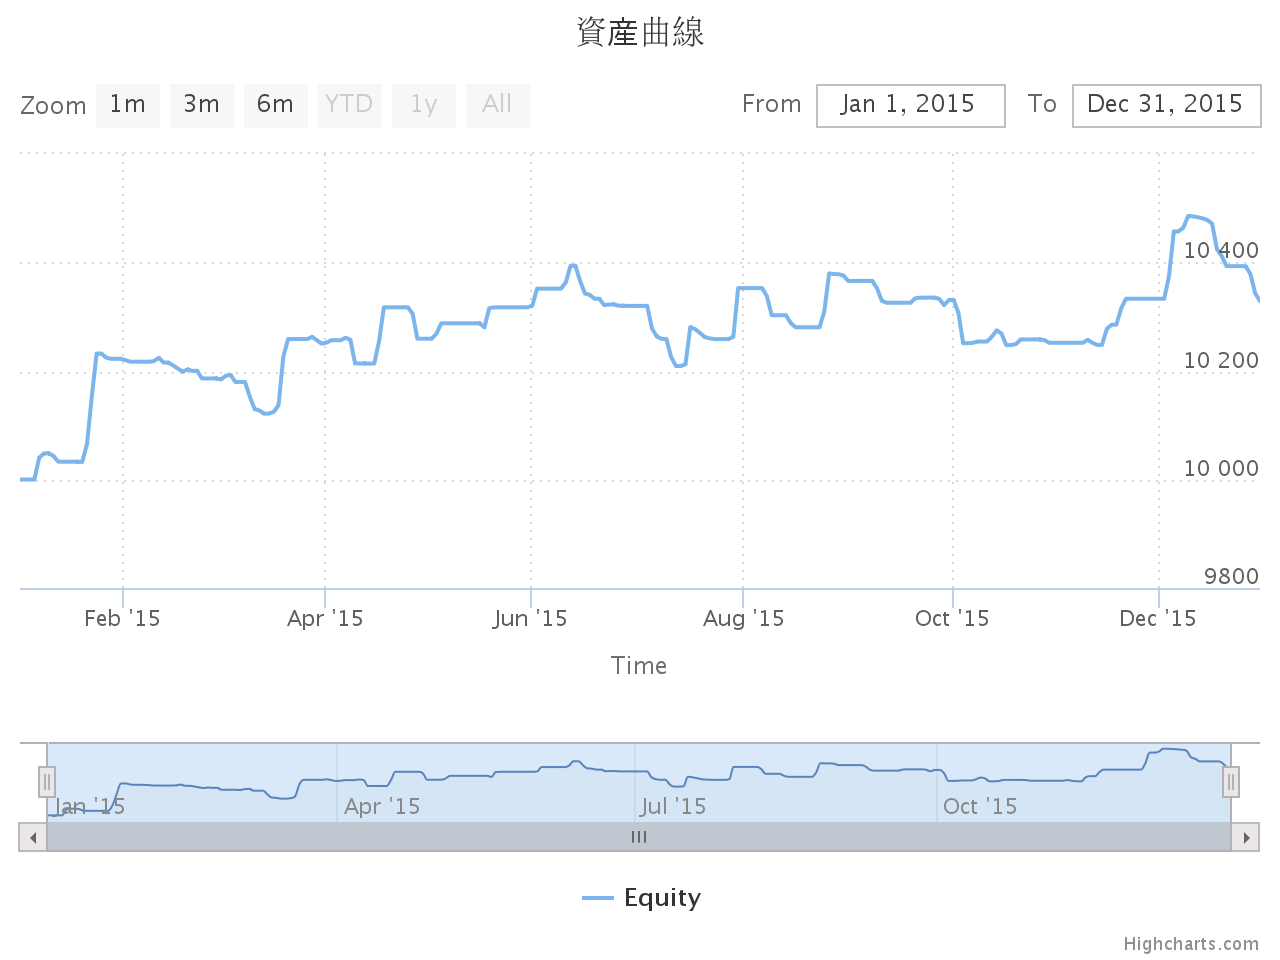
以下の例は、エントリーシグナル時の価格から20pips離れた指値で売買し、エグジットシグナルとは別に、100pipsの利益、あるいは50pipsの損失で決済するシステムのバックテストです。
Trade, PL = Backtest(ohlc, BuyEntry, SellEntry, BuyExit, SellExit, TP=100, SL=50, Limit=20)
今回は資産曲線だけ表示させてみます。
from pandas_highcharts.display import display_charts
Initial = 10000 # 初期資産
Equity = (PL.Long+PL.Short).cumsum() #累積損益
display_charts(pd.DataFrame({'Equity':Equity+Initial}), chart_type="stock", title="資産曲線", figsize=(640,480), grid=True)
なお、本記事で掲載したコードは以下にアップロードしてあります。
MT5IndicatorsPy/EA_sample2.ipynb