Ruby | Gviz で エラトステネスの篩 風味の有向グラフを作ってみる
概要
Gviz で エラトステネスの篩 風味の有向グラフを作ってみます。
ロジック自体は、エラトステネスの篩になっていませんが
出力される画像から エラトステネスの篩 を連想します。
仕様
- 素数を N 個取得し、 [初項 N1 ・ 交差 N1 の数列, 初項 N2 ・ 交差 N2 の数列 .., 初項 N-last ・ 交差 N-last の数列] という Enumerator 配列を作成する
- グラフ化の範囲は max 変数に設定。
- グラフには 1 から max までの数字を全て表示する
- 等差数列に含まれる数値は、数列の順に edge を設定し有向グラフとして表される
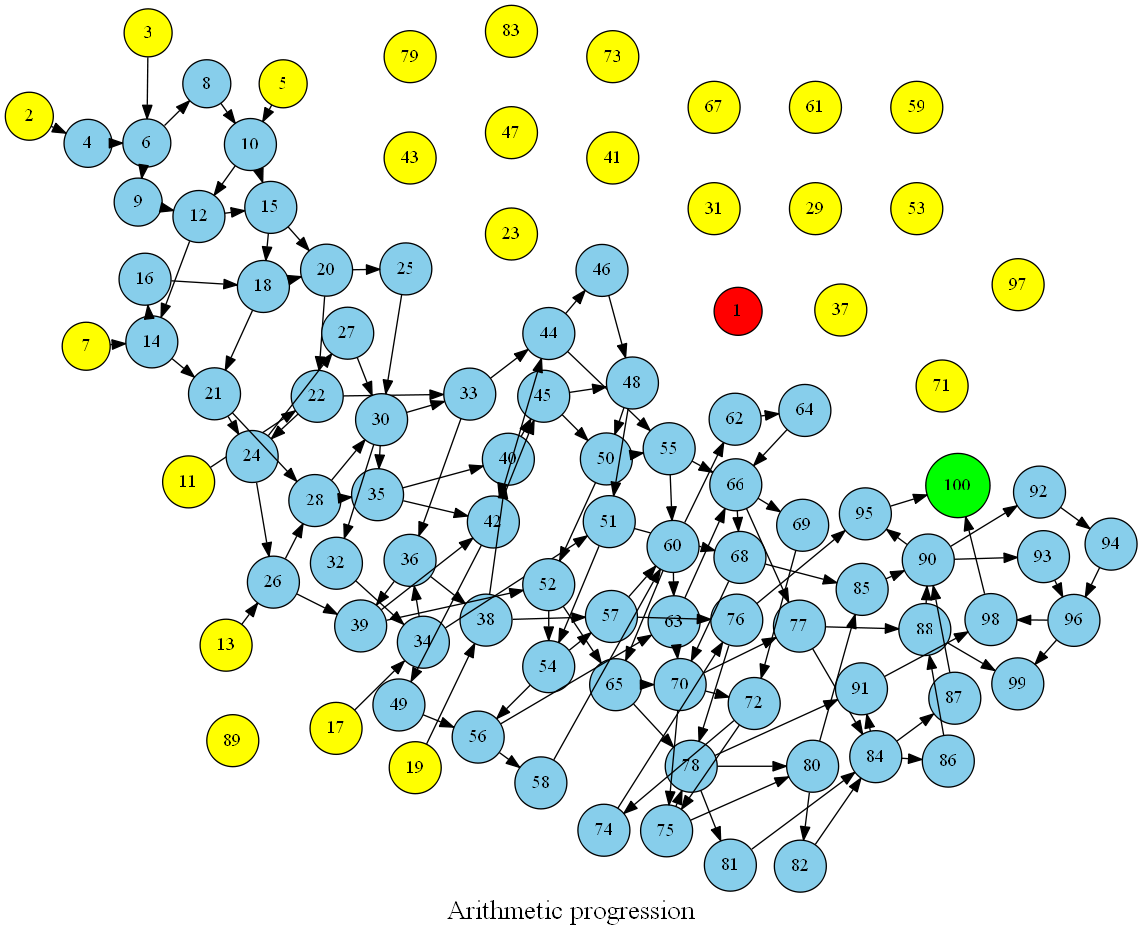
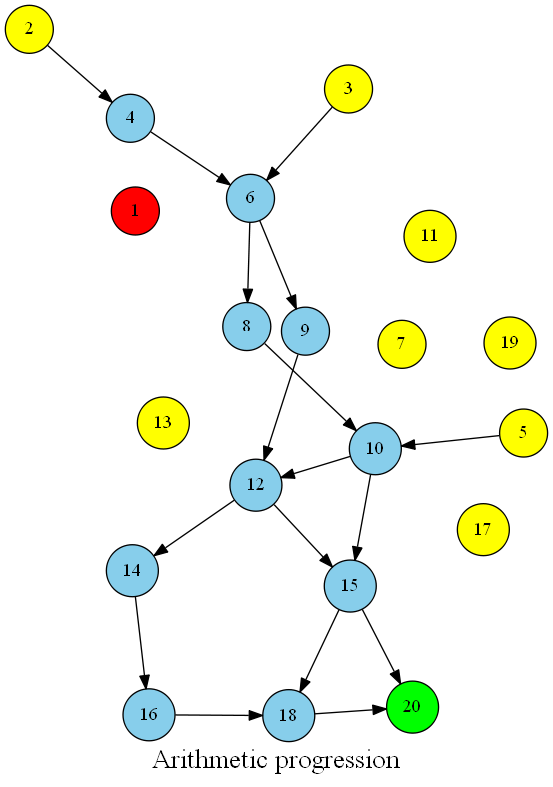
- 1 は赤で表示する
- 素数は黄で表示する
- 合成数は青で表示する
- 最後の数だけ緑で表示する
プログラム
require "gviz"
require "prime"

def arithmetic_progression_enum(base)
  Enumerator.new do |y|
    i = 0
    loop do
      y << i + base
      i += base
    end
  end
end

bases = *Prime.each(5)
arithmetic_progressions = Prime.each(5).with_object([]) do |prime, memo|
  memo << arithmetic_progression_enum(prime)
end

max = 30
Graph do
  global layout:'neato', label:'Arithmetic progression', fontsize:54, size:15
  nodes shape:'circle', style:'filled', fillcolor: :yellow

  (1..max).each { |i| node :"#{i}" }

  arithmetic_progressions.each_with_index do |e, i|
    e.take(max/bases[i]).each_cons(2).with_index do |e, j|
      route Hash[*e]
      node :"#{e.last}", { style: :filled, fillcolor: :skyblue }
    end
  end

  save :arithmetic_progression, :png
end
出力例1
- max = 20
- Primes => 2, 3, 5
出力例2
- max = 100
- Primes => 2, 3, 5, 7, 11, 13, 17, 19