---- ---- ----
追記: 2015/10/12
Dogstatsd を利用しての集計を Dogstatsd で Datadog にカスタムメトリクスを送る方法 〜Fluentd との連携を添えて〜 - TAKUMI SAKAMOTO’S BLOG に書きましたので、合わせて読んでいただければと思います。
---- ---- ----
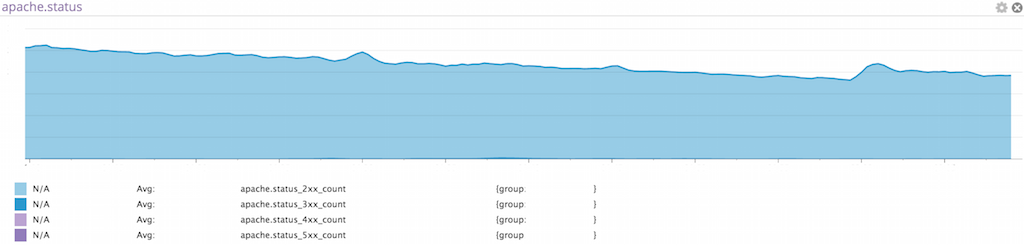
Datadog で Apache のステータスコードを監視するための方法です。下記のように可視化したり、5xx が一定数以上になったらアラートを飛ばすみたいなことができるようになります。例は apache と書いてありますが、nginx でもほぼ同じ方法でできるはずです。
<source>
    type tail
    format ltsv
    time_format %d/%b/%Y:%H:%M:%S %z
    path /var/log/httpd/access_log
    pos_file /tmp/access_log.pos
    tag apache.access
</source>

<match apache.access>
    type datacounter
    tag apache.status
    aggregate tag
    count_key status
    pattern1 2xx ^2\d\d$
    pattern2 3xx ^3\d\d$
    pattern3 4xx ^4\d\d$
    pattern4 5xx ^5\d\d$
</match>

# record_reformer がフィールド名の . を上手く扱えない
# rename_key でフィールド名を書き換える
<match apache.status>
    type rename_key
    append_tag renamed
    rename_rule1 ^apache\.access_(.+_count) apache_${md[1]}
</match>

# fluent-plugin-dd が必要とするデータ構造に変換する
# グループ毎に集計できるように tag を指定しておく
# {
#   "metric":"some.metric.name",
#   "value":100.0,
#   "tag":"any.tag",
#   "type":"gauge"
# }
<match apache.status.renamed>
    type copy
    <store>
      type record_reformer
      tag  datadog.apache.status
      <record>
        metric apache.status_2xx_count
        tag    group:web
        value  ${apache_2xx_count}
      </record>
    </store>
    <store>
      type record_reformer
      tag  datadog.apache.status
      <record>
        metric apache.status_3xx_count
        tag    group:web
        value  ${apache_3xx_count}
      </record>
    </store>
    <store>
      type record_reformer
      tag  datadog.apache.status
      <record>
        metric apache.status_4xx_count
        tag    group:web
        value  ${apache_4xx_count}
      </record>
    </store>
    <store>
      type record_reformer
      tag  datadog.apache.status
      <record>
        metric apache.status_5xx_count
        tag    group:web
        value  ${apache_5xx_count}
      </record>
    </store>
</match>

# ホスト毎に集計できるように hostname をつける
<match datadog.**>
    type forest
    subtype dd
    <template>
        dd_api_key xxxx
        host       ${hostname}
    </template>
</match>
ちなみに Datadog で上に貼ったようなグラフは下記のような JSON で作れます。
{
  "viz": "timeseries",
  "requests": [
    {
      "q": "sum:apache.status_2xx_count{group:web}, sum:apache.status_3xx_count{group:web}, sum:apache.status_4xx_count{group:web}, sum:apache.status_5xx_count{group:web}",
      "type": "area"
    }
  ],
  "events": []
}