構築環境について
Xubuntu amd64 16.10(Ubuntuの公式フレーバーディストリ)を用いました。
この環境に限らず公式がバイナリを配布しているOS・アーキテクチャで動作すると思われます。
インストール
https://prometheus.io/docs/introduction/getting_started/ を参考に
今回は公式ビルドのバイナリを用います。
GitHubのrelease ページ(もしくはここ https://prometheus.io/download/ )から"prometheus-*amd64.tar.gz" をダウンロード
https://prometheus.io/docs/introduction/getting_started/
$ cd ~
$ wget https://github.com/prometheus/prometheus/releases/download/v1.4.1/prometheus-1.4.1.linux-amd64.tar.gz
$ tar xvfz prometheus-*.tar.gz
$ cd prometheus-*
$ ./prometheus -config.file=prometheus.yml &
$ xdg-open http://localhost:9090
Webインターフェイスが起動します。
バイナリに同梱された設定ファイルは監視対象がPrometheus自身になっているので、
他のノードを監視する時これを変更する必要があります。
$ cat prometheus.yml
# my global config
global:
  scrape_interval:     15s # Set the scrape interval to every 15 seconds. Default is every 1 minute.
  evaluation_interval: 15s # Evaluate rules every 15 seconds. The default is every 1 minute.
  # scrape_timeout is set to the global default (10s).

  # Attach these labels to any time series or alerts when communicating with
  # external systems (federation, remote storage, Alertmanager).
  external_labels:
      monitor: 'codelab-monitor'

# Load rules once and periodically evaluate them according to the global 'evaluation_interval'.
rule_files:
  # - "first.rules"
  # - "second.rules"

# A scrape configuration containing exactly one endpoint to scrape:
# Here it's Prometheus itself.
scrape_configs:
  # The job name is added as a label `job=<job_name>` to any timeseries scraped from this config.
  - job_name: 'prometheus'

    # metrics_path defaults to '/metrics'
    # scheme defaults to 'http'.

    static_configs:
      - targets: ['localhost:9090']
監視対象の設定は[scrape_configs]→[static_configs]→[targets]で設定できます。
上記の設定は'localhost:9090' (9090ポートはPrometheusのWebポート)になっています。
exporterの設定
監視対象を設定するために監視エージェント(exporter)を設定します。
https://prometheus.io/download/ から
"node_exporter-*amd64.tar.gz" をダウンロード
$ cd ~
$ wget https://github.com/prometheus/node_exporter/releases/download/v0.13.0/node_exporter-0.13.0.linux-amd64.tar.gz
$ tar xvfz node_exporter-*.tar.gz
$ cd node_exporter-*
$ ./node_exporter &
ポート9100でhttpサーバーが起動します。
これを設定ファイルに記述すると監視が可能になります。
$ cd ~/prometheus*
$ cp prometheus.yml prometheus.yml.orig
$ vim prometheus.yml
$ diff -u prometheus.yml.orig prometheus.yml
--- prometheus.yml.orig 2017-01-06 13:12:24.369322429 +0900
+++ prometheus.yml 2017-01-06 13:13:01.721322429 +0900
@@ -24,4 +24,4 @@
# scheme defaults to 'http'.
static_configs:
- - targets: ['localhost:9090']
+ - targets: ['localhost:9100']
$ killall prometheus
$ ./prometheus -config.file=prometheus.yml &
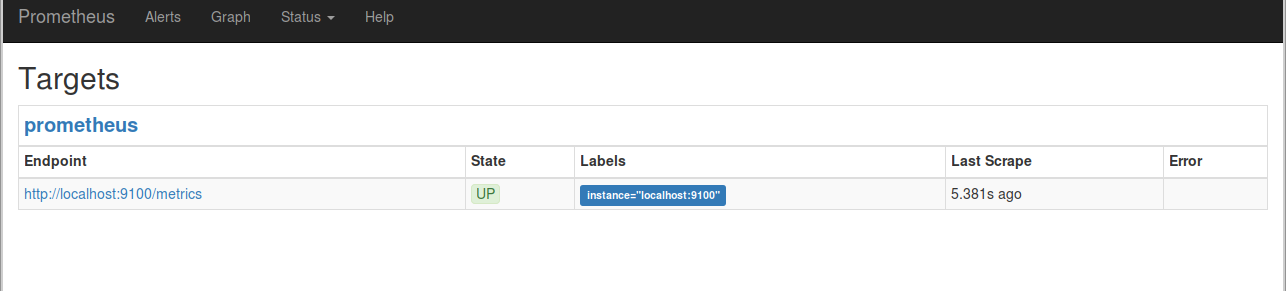
$ xdg-open http://localhost:9090/targets
監視対象のノードはこのように表示されます。
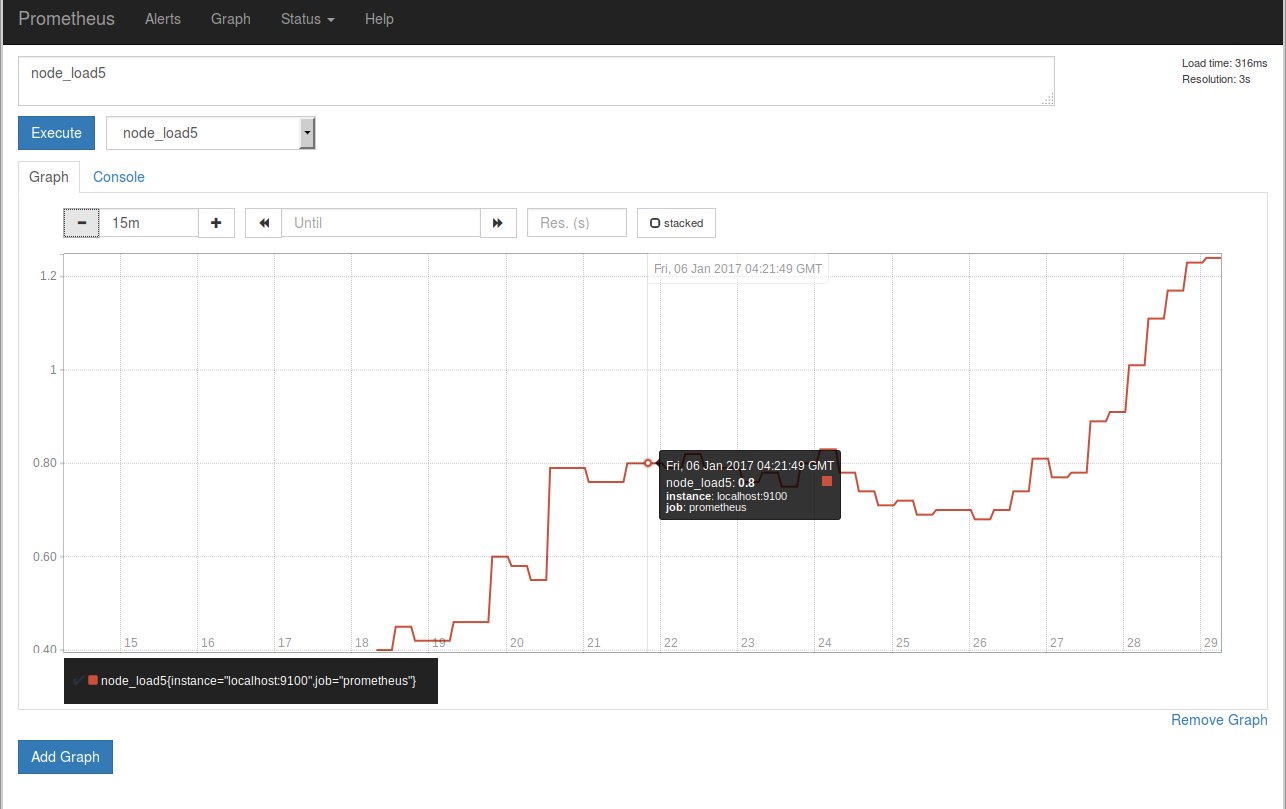
監視対象のグラフを適当に選びExecuteのボタンを押したあと、Graphタブを開くとこのようになります。
この設定ファイルで指定された 監視間隔は5sです。
現在node_exporterはlocalhostに立っているため、node_exporterが
出力する情報はPrometheusが動いているそのマシン自身の情報になります。
運用するためには監視を行いたいシステム上でnode_exporterを動かし、
static_configsのtargetsに追記する必要があります。
またtargetsにはグループごとにラベルをつけることも可能です。
static_configs:
  - targets: ['localhost:8080', 'localhost:8081']
    labels:
      group: 'production'

  - targets: ['localhost:8082']
    labels:
      group: 'canary'
node_exporterが出力する情報は、Targetsの画面のリンクから覗くことができます。
もしくはブラウザから "http://IP:PORT/metrics" にアクセスしてもよいです。
中身を見ると情報をテキストで出力しているだけのシンプルなAPIであることがわかります。
この情報をPrometheusは一定時間ごとに監視対象からPULLし、時系列データを収集します。
データとexporter
収集するデータはexporterに依存します、例えばnode_exporterはnode_memory_MemFreeを出力するので
監視対象のfreeになっているメモリを時系列で眺めることができますが、
例えばクリーンな環境からprometheus/client_golang/example/randomというexporterの例を動かしたシステムの監視をすると、
このexporterはそういったデータを出力しないのでnode_memory_MemFreeはグラフ画面のクエリ補完の候補に表示されません。
他のexporter
node_exporter以外にもexporterが存在します、Prometheus公式のリポジトリには
memcached_exporterやmysqld_exporterが存在します。
またexporterは自作することもでき、client_golangやclient_pythonといった公式のライブラリが存在します。
https://prometheus.io/docs/instrumenting/exporters/
グラフの単位について
値が大きいとき、グラフの縦軸にG(ギガ)ではなくBという単位がついていることがあります、
これはおそらくB(ビリオン)[10^9]です。
Alertmanagerの設定
Prometheus本体とは別にAlertmanagerが存在します、
Prometheusの設定ファイルから指定したいくつかのルールにしたがって、
AlertmanagerにPUSHが飛びます。
AlertmanagerはPUSHされたアラートをルーティングしたりまとめたり再送したりする仕事を
Prometheus本体とは別に行います。
https://prometheus.io/download/ から
"alertmanager-*amd64.tar.gz" をダウンロード
$ wget https://github.com/prometheus/alertmanager/releases/download/v0.5.1/alertmanager-0.5.1.linux-amd64.tar.gz
$ tar xvfz alertmanager-*.tar.gz
$ cd alertmanager-*
$ ./alertmanager -config.file=simple.yml &
Prometheus側のアラートルール
設定ファイルの[rule_files]からルールを指定することができます。
$ diff -u prometheus.yml.orig prometheus.yml
--- prometheus.yml.orig	2017-01-06 13:12:24.369322429 +0900
+++ prometheus.yml	2017-01-06 16:29:27.241558224 +0900
@@ -11,7 +11,7 @@

 # Load rules once and periodically evaluate them according to the global 'evaluation_interval'.
 rule_files:
-  # - "first.rules"
+   - "first.rules"
   # - "second.rules"

 # A scrape configuration containing exactly one endpoint to scrape:
rulesファイルはYAMLではなく独自の構文を用います。
たとえばドキュメント(https://prometheus.io/docs/alerting/rules/) には以下のような文法が書かれています、
ALERT <alert name>
  IF <expression>
  [ FOR <duration> ]
  [ LABELS <label set> ]
  [ ANNOTATIONS <label set> ]
ALERT: アラート名
IF: アラートの条件
FOR: アラートの待機時間(FORの時間内にIFを満たさなくなるとアラートがactiveでなくなる)
LABELS: アラートに対してラベルを貼る
ANNOTATIONS: 注釈設定
summary: 概要
description: 説明
これは具体的な設定例になると以下のようになります。
# Alert for any instance that is unreachable for >5 minutes.
ALERT InstanceDown
  IF up == 0
  FOR 5m
  LABELS { severity = "page" }
  ANNOTATIONS {
    summary = "Instance {{ $labels.instance }} down",
    description = "{{ $labels.instance }} of job {{ $labels.job }} has been down for more than 5 minutes.",
  }
このルール設定は特定のexporterがダウンしている(up == 0)と5分待機し、
その間にこの条件から外れなかった場合、重要度をpageにラベルづけし、
概要に"インスタンスがダウンしました"、説明に"特定のインスタンスのあるジョブが5分間ダウンしています"と設定し
アラートをAlertmanagerにPUSHします。
このような設定も可能です。
# Alert for any instance that have a median request latency >1s.
ALERT APIHighRequestLatency
  IF api_http_request_latencies_second{quantile="0.5"} > 1
  FOR 1m
  ANNOTATIONS {
    summary = "High request latency on {{ $labels.instance }}",
    description = "{{ $labels.instance }} has a median request latency above 1s (current value: {{ $value }}s)",
  }
rules文法のチェック
$ promtool check-rules /path/to/example.rules で文法をチェックすることができます、
promtoolはPrometheusの配布バイナリに同梱されています。
rulesの書き方
IFの条件の右辺に大きい値を書き込みたくなるときがあると思います、
指数表記で 1.6e+9 のように書くことが可能です。
テンプレート構文
LABELSとANNOTATIONSの中の値はテンプレート構文を使用することができます。
このテンプレートにはGoの標準ライブラリのtemplate言語を使用しており、
詳細な仕様は https://golang.org/pkg/text/template/ から参照できます。
Alertmanagerの設定
Alertmanager側の設定では、受け取ったアラートのルーティングの決定や
複数のアラートをまとめるための閾値などを設定します。
アラートのPUSH先にはメール(smtp)やSlack、HipChatなどを指定できます。
Alertmanagerの動作確認サンプル
Alertmanagerの動作を確認するため、さきほどのアラートルールを設定して
メールを配送する実験を行います。ノードを1つ監視させたあと、Prometheusが起動中に
プロセスを終了させ、監視ルールがそれを検知し
AlertがPENDINGされPUSHされAlertmanagerがそれを受け取り、実際にメールが配信されることを確認します。
メール配信設定
Alertmanagerの設定にsmtpでメールを送信するための設定を行います。
今回は試験的にGmailを用います、ただしGmailのセキュリティ設定によっては送信がブロックされることがあります、
そのような通知が出た場合、セキュリティレベルを一時下げてください。
node_exporterを再起動します。
$ cd ~/node_exporter-*
$ killall node_exporter
$ ./node_exporter
次にAlertmanagerも起動します。Alertmanagerのポートはデフォルトでは9093番です。
設定ファイルは以下のように書きます。
ユーザー名、パスワードは個別に埋める必要があります。
$ cd ~/alertmanager-*
$ cat gmail_alert_testing.yml
global:
  # The smarthost and SMTP sender used for mail notifications.
  smtp_smarthost: 'smtp.gmail.com:587'
  smtp_from: 'YOUR.ADDRESS@gmail.com'
  smtp_auth_username: 'YOUR.ADDRESS@gmail.com'
  smtp_auth_password: 'YOUR_PASSWORD'
# The root route on which each incoming alert enters.
route:
  group_by: ['prometheus_alert_test']
  group_wait: 30s
  group_interval: 5m
  repeat_interval: 3h

  # A default receiver
  receiver: mytest
receivers:
- name: 'mytest'
  email_configs:
  - to: 'SEND.TO@gmail.com'
    from: "YOUR.ADDRESS@gmail.com"
$ ./alertmanager -config.file=gmail_alert_testing.yml
最後にPrometheus本体を起動します、この時設定ファイルに加えて
Alertmanagerのアクセス先を指定する必要があります。
$ ~/prometheus
$ cat prometheus.yml
# my global config
global:
  scrape_interval:     15s # Set the scrape interval to every 15 seconds. Default is every 1 minute.
  evaluation_interval: 15s # Evaluate rules every 15 seconds. The default is every 1 minute.
  # scrape_timeout is set to the global default (10s).

  # Attach these labels to any time series or alerts when communicating with
  # external systems (federation, remote storage, Alertmanager).
  external_labels:
      monitor: 'codelab-monitor'

# Load rules once and periodically evaluate them according to the global 'evaluation_interval'.
rule_files:
   - "test_alert.rules"
scrape_configs:
  # The job name is added as a label `job=<job_name>` to any timeseries scraped from this config.
  - job_name: 'prometheus_alert_test'
    # metrics_path defaults to '/metrics'
    # scheme defaults to 'http'.
    static_configs:
      - targets: ['localhost:9100']

$ cat test_alert.rules
ALERT InstanceDown
  IF up == 0
  FOR 1m
  LABELS { severity = "page" }
  ANNOTATIONS {
    summary = "Instance {{ $labels.instance }} down",
    description = "{{ $labels.instance }} of job {{ $labels.job }} has been down for more than a minutes.",
  }
$ killall prometheus
$ ./prometheus -config.file=prometheus.yml -alertmanager.url=http://localhost:9093
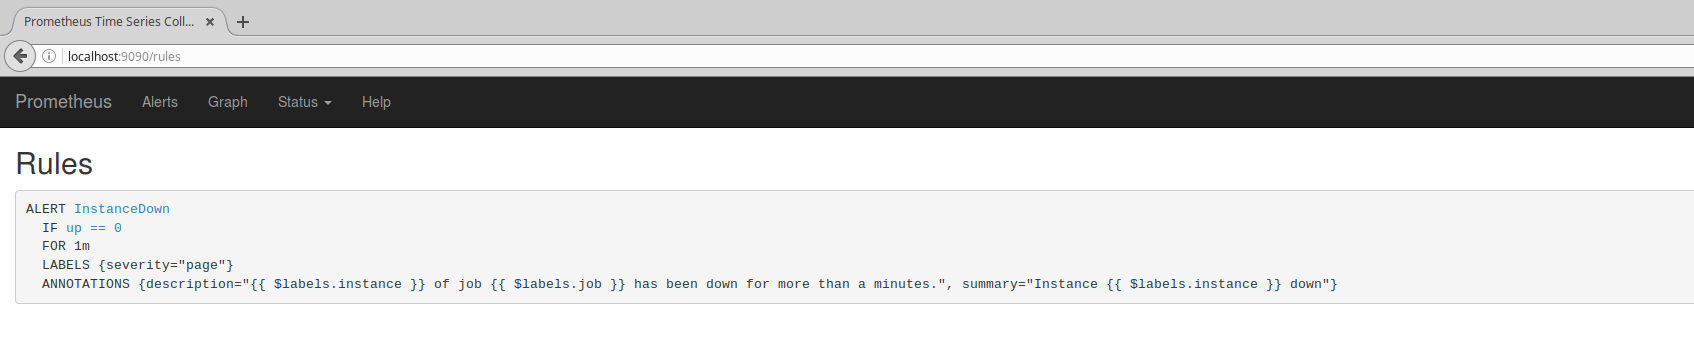
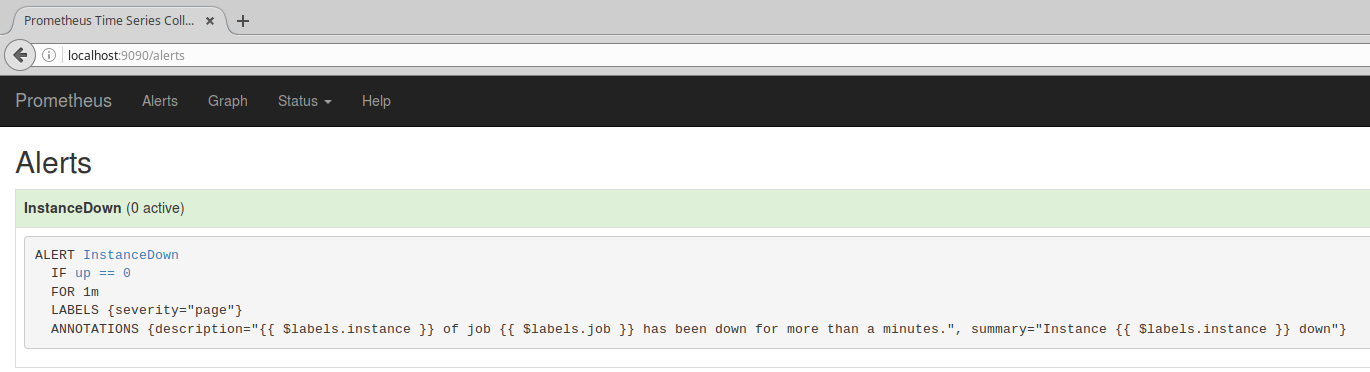
この状態で各種設定をWebブラウザから確認するとこのようになります。
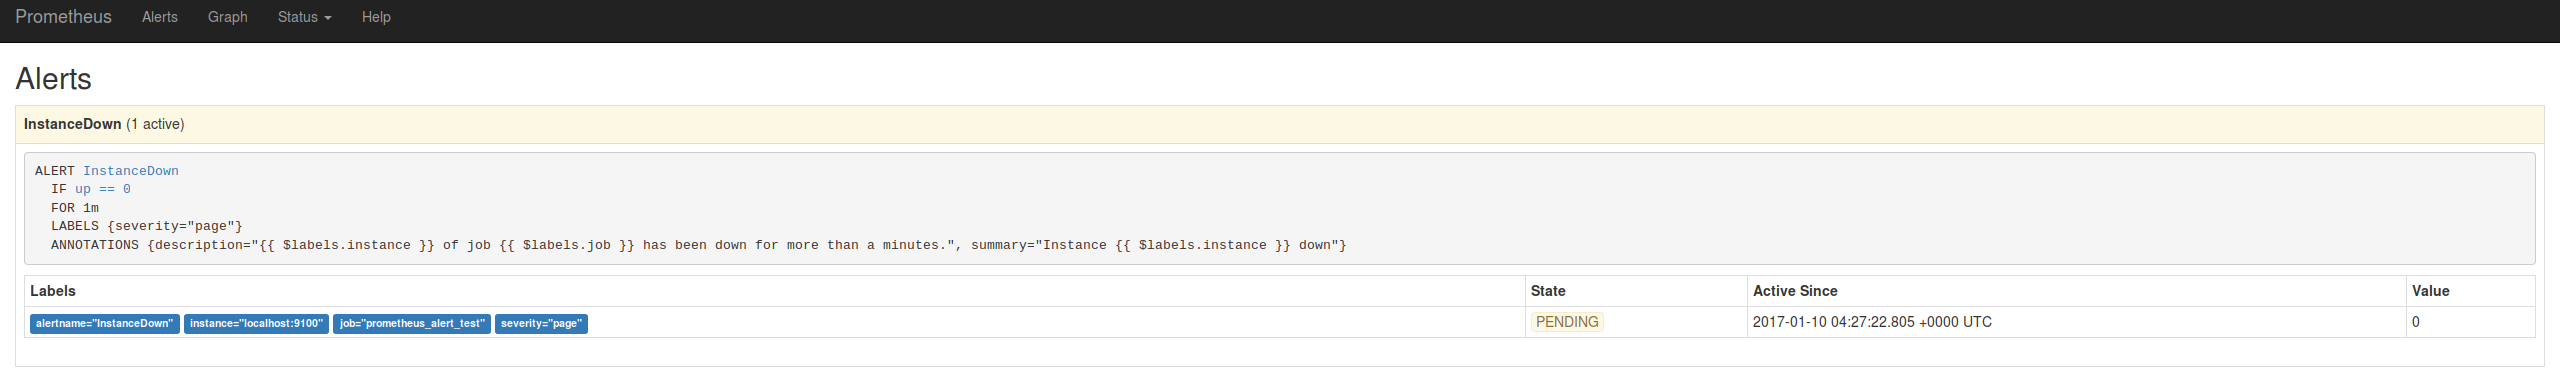
意図的にnode_exporterを落として、Alertを発生させます。
$ killall node_exporter
しばらくした後(およそ15秒)、Alert画面を確認すると
確かにAlertがアクティブになり、通知がPENDINGになっていることが確認できます。
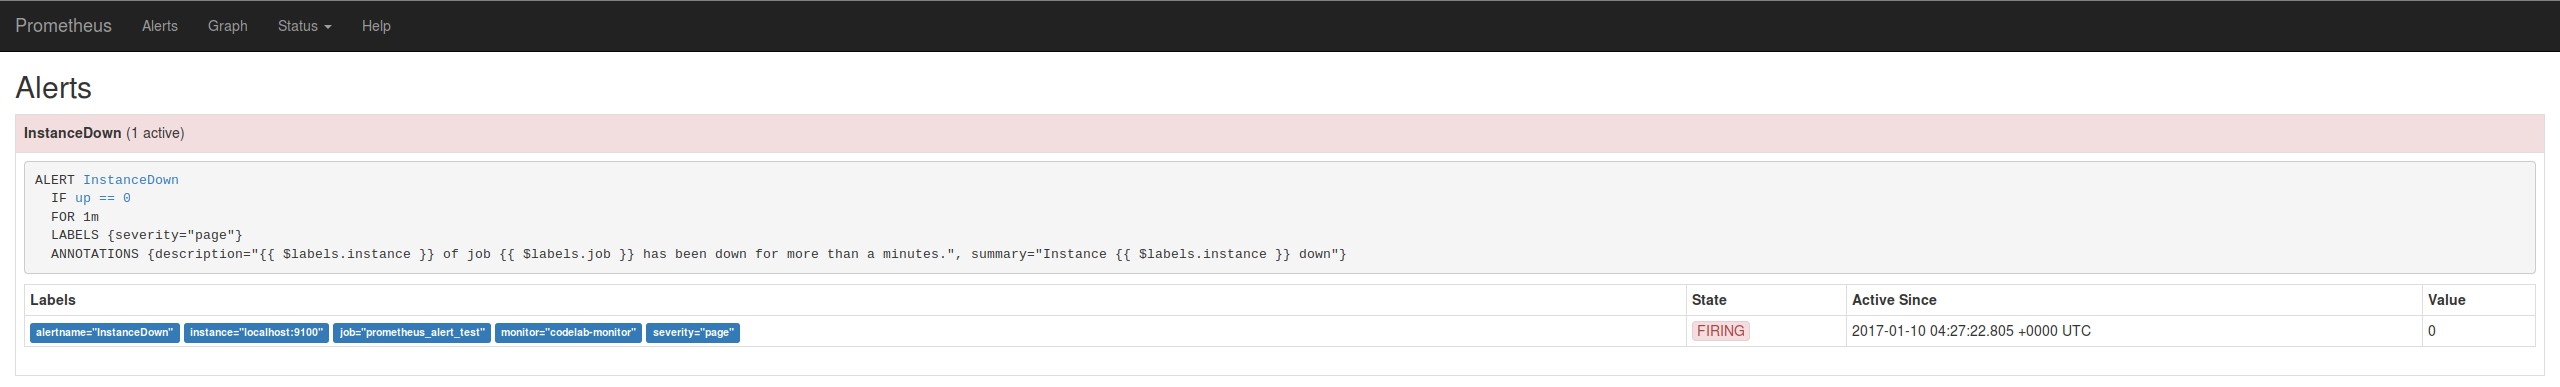
さらに1分ほどnode_exporterを落としたまま待機すると、AlertがFIREされ
設定したAlertmanagerにPUSHされます。
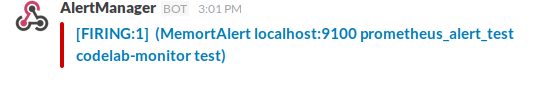
ではAlertmanagerを確認してみましょう。
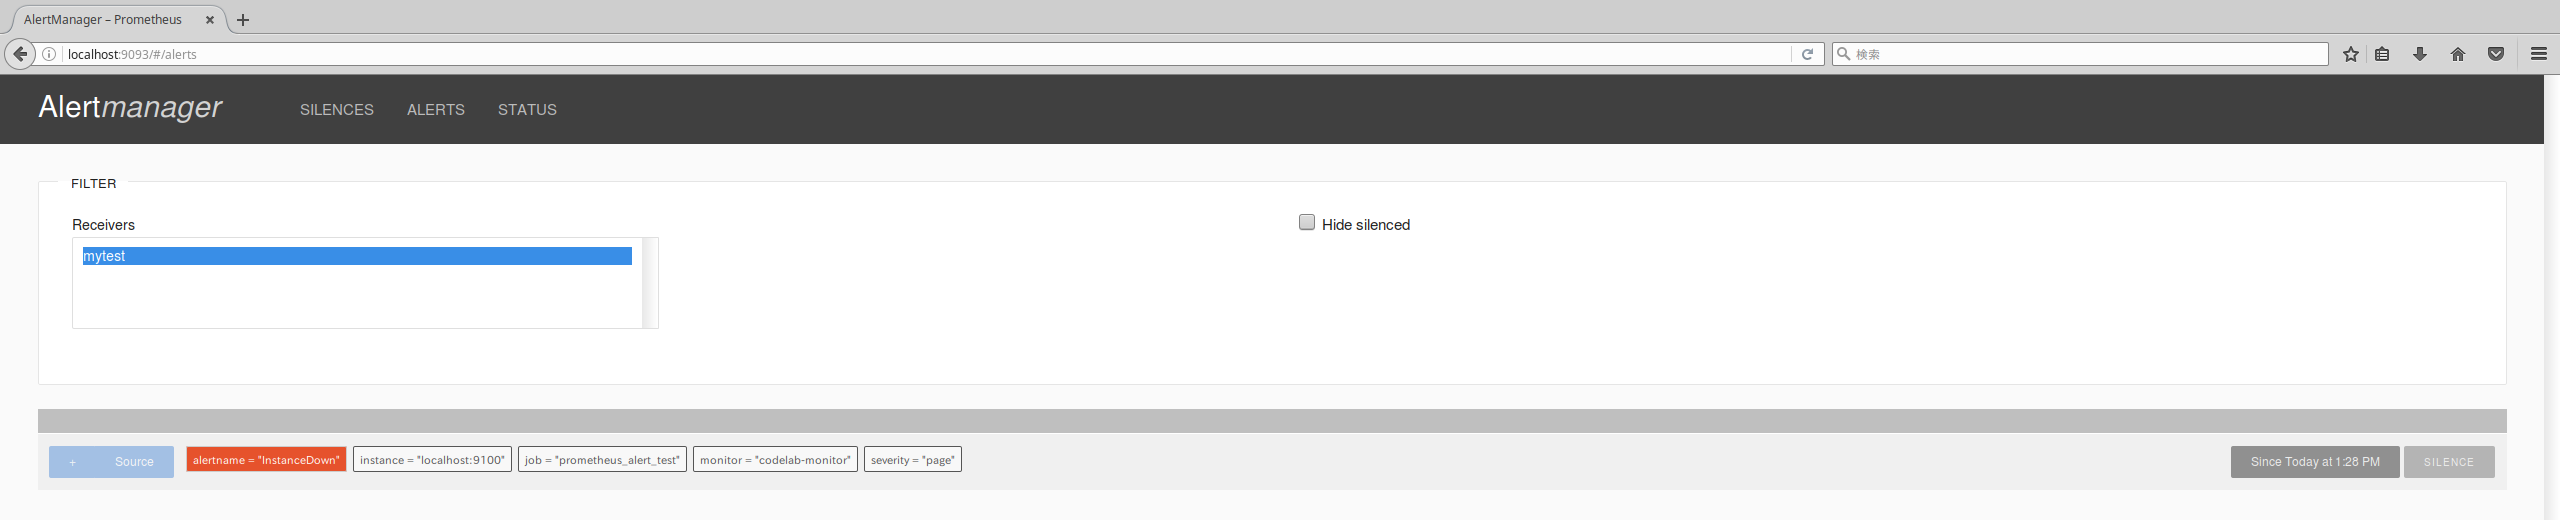
たしかに先ほどのAlertがAlertmanagerにPUSHされています。
Alertmanagerはこれを受け取り、設定ファイルにしたがってメールなどでAlertを配送します。
Alertmanagerは受け取った通知を即時に通知するとは限らず、設定にしたがっていくつかのAlertをまとめたりすることを行います。
配送先のメールボックスから通知メールを確認してみましょう。
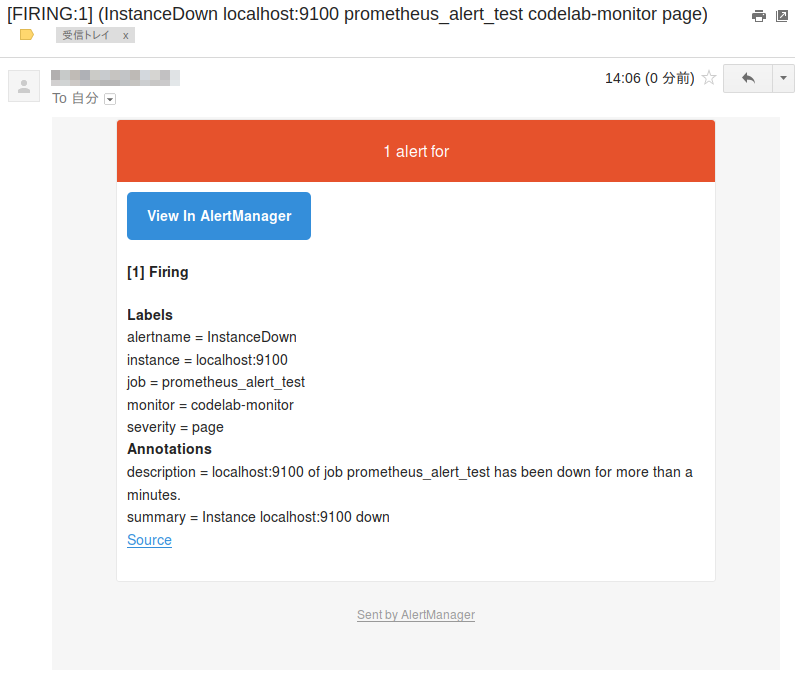
確かにメールが確認できました。
配信先をメール以外にSlackやHipchatにすることも可能です。
配信先をSlackに変えるには、email_configをslack_configに変えて、トークンを入れたAPIのエンドポイントなどを設定して追加します。
$ diff -u gmail_alert.yml slack_alert.yml
--- gmail_alert.yml	2017-01-10 17:35:25.303156612 +0900
+++ slack_alert.yml	2017-01-11 15:07:33.549484771 +0900
@@ -15,6 +15,6 @@
   receiver: mytest
 receivers:
 - name: 'mytest'
-  email_configs:
-  - to: 'SEND.TO@gmail.com'
-    from: "YOUR.ADDRESS@gmail.com"
+  slack_configs:
+  - api_url: 'https://hooks.slack.com/services/TXXXXXXXX/XXXXXXXXX/XXXXXXXxXXXxxXXXXXxXxxXx'
+    channel: '#notification'
Slackではこのような通知になります。