k6というカジュアルな負荷テストのパフォーマンス計測用ツールがあります。
触ってみた感じ、なかなか良かった![]() ので触りだけまとめます。
ので触りだけまとめます。
LOAD IMPACTという実績のあるサービスを運営している会社が出したツールです。
https://loadimpact.com/
![]() ドキュメント
ドキュメント
https://k6.readme.io/
![]() GitHub
GitHub
https://github.com/loadimpact/k6
インストール
Macならbrewで入ります。Dockerでも簡単にインストールできるので好きな方でインストールすればいいと思います。
brewで入れてみたら、go, icu4c, nodeに依存しているようで、自分の環境だと5分程度かかりました。
バージョンは、0.13.0です。
$ brew tap loadimpact/k6
$ brew install k6
:
==> Installing k6 from loadimpact/k6
==> Installing dependencies for loadimpact/k6/k6: go, icu4c, node
:
🍺  /usr/local/Cellar/k6/0.13.0: 3 files, 22.5MB, built in 5 minutes 43 seconds
$ k6 --version
k6 version 0.13.0
APIを確認する
シンプルですね。それぞれのコマンドにもオプションがあるので詳しくはヘルプを確認するのが良いと思います。
$ k6
NAME:
   k6 - a next generation load generator

USAGE:
   k6 [global options] command [command options] [arguments...]

VERSION:
   0.13.0

COMMANDS:
     run         Starts running a load test
     inspect, i  Merges and prints test configuration
     status      Looks up the status of a running test
     stats       Prints stats for a running test
     scale       Scales a running test
     pause       Pauses a running test
     resume      Resumes a paused test
     help, h     Shows a list of commands or help for one command

GLOBAL OPTIONS:
   --verbose, -v              show debug messages
   --address value, -a value  address for the API (default: "127.0.0.1:6565") [$K6_ADDRESS]
   --no-color, -n             disable colored output [$K6_NO_COLOR]
   --version                  print the version
Sampleを動かしてみる
公式リポジトリに、いろいろなパターンのサンプルが用意されています。
そこからいくつか抜粋して基本機能を見ていきます。
https://github.com/loadimpact/k6/blob/master/samples/
基本形
テストを実行するには、urlまたはfilenameを指定することができます。
URLを指定すると、テスト用のファイルをfetchしてきて実行してくれます。
テストが終わると、HTTPリクエストについて送受信バイトやロードの統計などが表示されます。
実行結果
こんな感じ。
$ k6 run github.com/loadimpact/k6/samples/http_get.js

          /\      |‾‾|  /‾‾/  /‾/
     /\  /  \     |  |_/  /  / /
    /  \/    \    |      |  /  ‾‾\
   /          \   |  |‾\  \ | (_) |
  / __________ \  |__|  \__\ \___/  Welcome to k6 v0.13.0!

  execution: local
     output: -
     script: github.com/loadimpact/k6/samples/http_get.js (js)

   duration: 0s, iterations: 1
        vus: 1, max: 1

    web ui: http://127.0.0.1:6565/

      done [==========================================================]      900ms / 900ms

    data_received.........: 828 B
    data_sent.............: 100 B
    http_req_blocked......: avg=686.28ms max=686.28ms med=686.28ms min=686.28ms p90=686.28ms p95=686.28ms
    http_req_connecting...: avg=282.81ms max=282.81ms med=282.81ms min=282.81ms p90=282.81ms p95=282.81ms
    http_req_duration.....: avg=285.47ms max=285.47ms med=285.47ms min=285.47ms p90=285.47ms p95=285.47ms
    http_req_receiving....: avg=114.15µs max=114.15µs med=114.15µs min=114.15µs p90=114.15µs p95=114.15µs
    http_req_sending......: avg=71.44µs max=71.44µs med=71.44µs min=71.44µs p90=71.44µs p95=71.44µs
    http_req_waiting......: avg=285.29ms max=285.29ms med=285.29ms min=285.29ms p90=285.29ms p95=285.29ms
    http_reqs.............: 1
    iterations............: 1
    vus...................: 1
    vus_max...............: 1
-vオプションをつけると、DEBUG用出力が追加されツールがどのように動いているか確認できます。
$ k6 -v run github.com/loadimpact/k6/samples/http_get.js
DEBU[0000] Fetching source...                            url="https://raw.githubusercontent.com/loadimpact/k6/master/samples/http_get.js"
DEBU[0001] Fetched!                                      len=119 t=829.531369ms url="https://raw.githubusercontent.com/loadimpact/k6/master/samples/http_get.js"
DEBU[0001] Babel: Transformed                            t=62.096707ms

          /\      |‾‾|  /‾‾/  /‾/
     /\  /  \     |  |_/  /  / /
    /  \/    \    |      |  /  ‾‾\
   /          \   |  |‾\  \ | (_) |
  / __________ \  |__|  \__\ \___/  Welcome to k6 v0.13.0!

  execution: local
     output: -
     script: github.com/loadimpact/k6/samples/http_get.js (js)

   duration: 0s, iterations: 1
        vus: 1, max: 1

    web ui: http://127.0.0.1:6565/

DEBU[0001] Starting engine...                           =============] -- / --
DEBU[0002] run: hit iteration cap; exiting...            cap=1 total=1]      700ms / 0s
DEBU[0002] Engine terminated
DEBU[0002] Engine terminated; shutting down...
      done [==========================================================]      700ms / 700ms
:
ユーザ数(Virtual User)および実行時間(Duration)を指定する
テストの実行時に、ユーザ数(Virtual User)と実行時間(Duration)を指定できるので、やってみます。
以下は、複数URLに対してロードテストを行い、check関数を使ってレスポンスのstatusやbodyを検証しています。
import { check } from 'k6';
import http from 'k6/http';

export default function() {
  const responses = http.batch([
    "http://test.loadimpact.com",
    "http://test.loadimpact.com/pi.php"
  ]);

  check(responses[0], {
    "main page 200": res => res.status === 200,
  });

  check(responses[1], {
    "pi page 200": res => res.status === 200,
    "pi page has right content": res => res.body === "3.14",
  });
};
実行結果はこんな感じ。それぞれのcheckに関してのstatsも取れています。
$ k6 run --vus 5 --duration 5s --linger github.com/loadimpact/k6/samples/http_batch.js

          /\      |‾‾|  /‾‾/  /‾/
     /\  /  \     |  |_/  /  / /
    /  \/    \    |      |  /  ‾‾\
   /          \   |  |‾\  \ | (_) |
  / __________ \  |__|  \__\ \___/  Welcome to k6 v0.13.0!

  execution: local
     output: -
     script: github.com/loadimpact/k6/samples/http_batch.js (js)

   duration: 5s, iterations: 0
        vus: 5, max: 5

    web ui: http://127.0.0.1:6565/

      done [==========================================================]         5s / 5s

    ✓ 100.00% - pi page 200
    ✓ 100.00% - pi page has right content
    ✓ 100.00% - main page 200

    checks................: 100.00%
    data_received.........: 74 kB (15 kB/s)
    data_sent.............: 15 kB (3.1 kB/s)
    http_req_blocked......: avg=22.52ms max=336.08ms med=0s min=0s p90=0s p95=335.43ms
    http_req_connecting...: avg=22.42ms max=334.39ms med=0s min=0s p90=0s p95=333.84ms
    http_req_duration.....: avg=303.35ms max=344.58ms med=305.94ms min=261.08ms p90=327.56ms p95=333.98ms
    http_req_receiving....: avg=82.64µs max=322.01µs med=84.09µs min=22.79µs p90=134.36µs p95=144.36µs
    http_req_sending......: avg=22.79µs max=211.99µs med=15.55µs min=10.44µs p90=34.94µs p95=57.62µs
    http_req_waiting......: avg=303.25ms max=344.39ms med=305.85ms min=261.02ms p90=327.42ms p95=333.84ms
    http_reqs.............: 149 (29.8/s)
    iterations............: 75 (15/s)
    vus...................: 5
    vus_max...............: 5
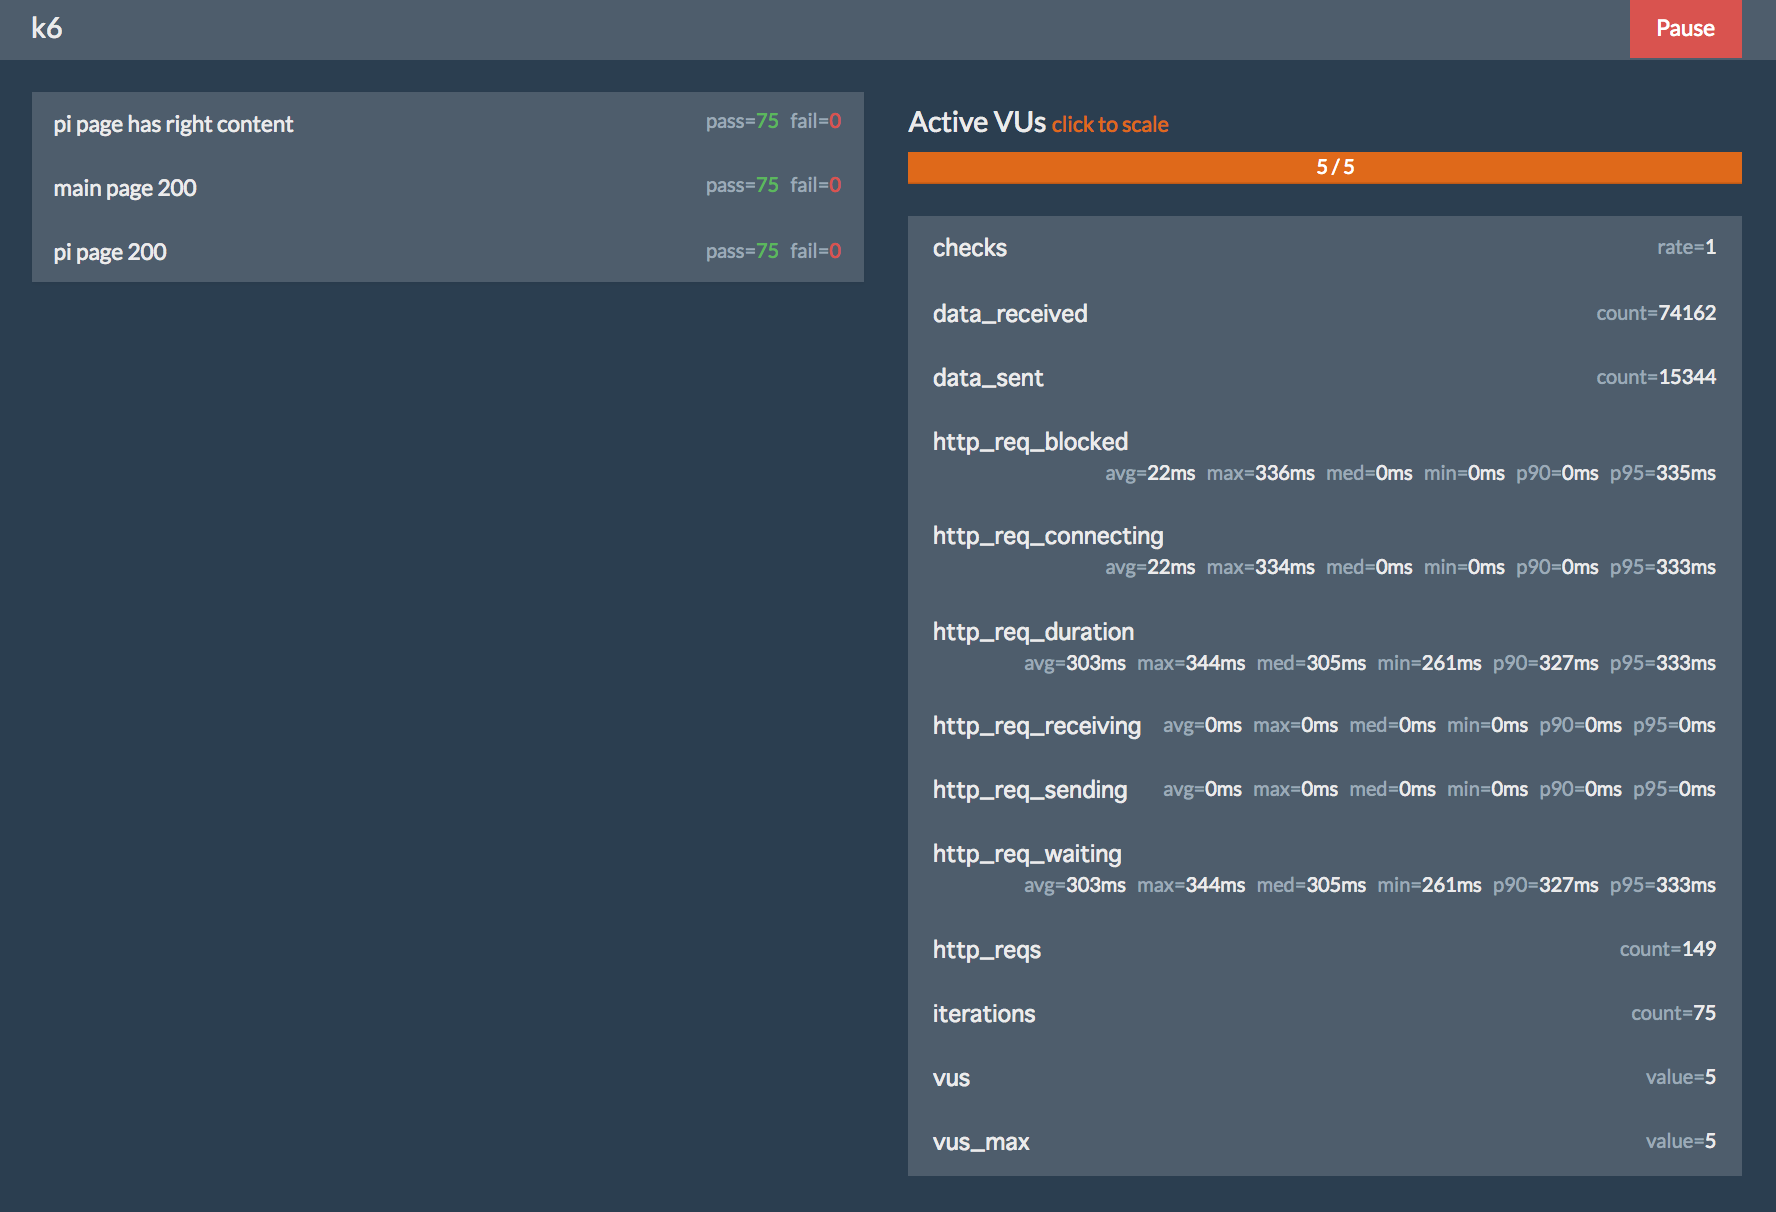
ちなみに、上記の例では、--lingerオプションを付けて、durationが終わった後もプロセスが終了しないようにしています。
このオプションにどんな意味があるのかよくわからなかったのですが、テスト実行中はWebサーバーが起動しているのでテストが終わった後からもブラウザで実行結果を確認したいときなどに使うのだと思われます(たぶんだけど![]() )
)
ちなみに、ブラウザで確認するとこんな感じです。
メトリクス
メトリクスは大別すると2種類で、「組み込みメトリクス」と「カスタムメトリクス」があります。
組み込みメトリクスは、先程の実行結果にあるhttp_reqsやvus等になります。
メトリクスの種類は以下で確認できます。
https://k6.readme.io/docs/result-metrics
カスタムメトリクスは、自分でメトリクスを追加することができる機能です。
サンプルコードで見ていきます。
今回はdockerからk6を実行してみます。
dockerでのインストールはdocker pull loadimpact/k6だけです。
まずは、実行結果から。
$ docker run -i loadimpact/k6 run --duration 3s github.com/loadimpact/k6/samples/custom_metrics.js

          /\      |‾‾|  /‾‾/  /‾/
     /\  /  \     |  |_/  /  / /
    /  \/    \    |      |  /  ‾‾\
   /          \   |  |‾\  \ | (_) |
  / __________ \  |__|  \__\ \___/  Welcome to k6 v0.12.2!

  execution: local
     output: -
     script: github.com/loadimpact/k6/samples/custom_metrics.js (js)

   duration: 3s, iterations: 0
        vus: 1, max: 1

    web ui: http://0.0.0.0:6565/

[running   ] 900ms / 3s
[running   ] 1.9s / 3s
[running   ] 2.9s / 3s
[done      ] 3s / 3s

    ✓ 100.00% - status is 200

    checks................: 100.00%
    data_received.........: 103 kB (34 kB/s)
    data_sent.............: 736 B (245 B/s)
    http_req_blocked......: avg=47.03ms max=376.29ms med=0s min=0s p90=376.29ms p95=376.29ms
    http_req_connecting...: avg=44.66ms max=357.28ms med=0s min=0s p90=357.28ms p95=357.28ms
    http_req_duration.....: avg=307.04ms max=317.57ms med=305.82ms min=301.15ms p90=317.57ms p95=317.57ms
    http_req_receiving....: avg=2.47ms max=5.18ms med=2.28ms min=130.15µs p90=5.18ms p95=5.18ms
    http_req_sending......: avg=35.32µs max=91.59µs med=27.81µs min=20.97µs p90=91.59µs p95=91.59µs
    http_req_waiting......: avg=304.53ms max=312.3ms med=305.33ms min=296.46ms p90=312.3ms p95=312.3ms
    http_reqs.............: 8 (2.6666666666666665/s)
    iterations............: 8 (2.6666666666666665/s)
    my_counter............: 8 (2.6666666666666665/s)
    my_gauge..............: 317.578409
    my_rate...............: 100.00%
    my_trend..............: avg=44.660937 max=357.287496 med=0 min=0 p90=357.287496 p95=357.287496
    vus...................: 1
    vus_max...............: 1
my_counter, my_gauge, my_rate, my_trendが追加されました。
実行したスクリプトを確認します。
import http from "k6/http";
import { Counter, Gauge, Rate, Trend } from "k6/metrics";
import { check } from "k6";

/*
 * Custom metrics are useful when you want to track something that is not
 * provided out of the box.
 *
 * There are four types of custom metrics: Counter, Gauge, Rate and Trend.
 *
 * - Counter: a sum of all values added to the metric
 * - Gauge: a value that change to whatever you set it to
 * - Rate: rate of "truthiness", how many values out of total are !=0
 * - Trend: time series, all values are recorded, statistics can be calculated
 *          on it
 */

let myCounter = new Counter("my_counter");
let myGauge = new Gauge("my_gauge");
let myRate = new Rate("my_rate");
let myTrend = new Trend("my_trend");

let maxResponseTime = 0.0;

export default function() {
    let res = http.get("http://httpbin.org/");
    let passed = check(res, { "status is 200": (r) => r.status === 200 });

    // Add one for number of requests
    myCounter.add(1);

    // Set max response time seen
    maxResponseTime = Math.max(maxResponseTime, res.timings.duration);
    myGauge.add(maxResponseTime);

    // Add check success or failure to keep track of rate
    myRate.add(passed);

    // Keep track of DNS+TCP-connecting part of the response time
    myTrend.add(res.timings.looking_up + res.timings.connecting);
}
上記結果で、my_trendを例として確認してみます。
レスポンス時間からDNSとTCP接続を合算したものだけ抽出して、カスタムメトリクス化しています。
カスタムメトリクスは、Counter, Gauge, Rate, Trendの4種類があるようで、それぞれ目的に応じた使い分けができるようになっています。
上記サンプルでそれぞれのタイプの使い方が網羅されているので、これを見ておけばだいたい使い方が分かります![]()
たった4種類しかないので覚えることも少なく、簡単にメトリクスの設計・実装ができそうです。
スレッショルド
k6では、パフォーマンステストのスレッショルドを自分で設定することができます。
メトリクスにスレッショルドを設定すると、その条件をpassしたかfailしたか確認できます。
サンプルの実行結果を確認してから、ソースを確認します。
スレッショルドを設定した、http_req_duration と http_req_duration{url:http://httpbin.org/post} に ✓ が付いています。
$ docker run -i loadimpact/k6 run --duration 3s github.com/loadimpact/k6/samples/thresholds.js

          /\      |‾‾|  /‾‾/  /‾/
     /\  /  \     |  |_/  /  / /
    /  \/    \    |      |  /  ‾‾\
   /          \   |  |‾\  \ | (_) |
  / __________ \  |__|  \__\ \___/  Welcome to k6 v0.12.2!

  execution: local
     output: -
     script: github.com/loadimpact/k6/samples/thresholds.js (js)

   duration: 3s, iterations: 0
        vus: 1, max: 1

    web ui: http://0.0.0.0:6565/

[running   ] 900ms / 3s
[running   ] 1.9s / 3s
[running   ] 2.9s / 3s
[done      ] 3s / 3s

    data_received....................................: 54 kB (18 kB/s)
    data_sent........................................: 1.1 kB (362 B/s)
    http_req_blocked.................................: avg=55.31ms max=442.53ms med=0s min=0s p90=442.53ms p95=442.53ms
    http_req_connecting..............................: avg=53.12ms max=424.99ms med=0s min=0s p90=424.99ms p95=424.99ms
  ✓ http_req_duration................................: avg=307.01ms max=311.77ms med=306.84ms min=302.77ms p90=311.77ms p95=311.77ms
  ✓ http_req_duration{url:http://httpbin.org/post}...: avg=303.73ms max=303.73ms med=303.73ms min=303.73ms p90=303.73ms p95=303.73ms
    http_req_receiving...............................: avg=768.26µs max=2.45ms med=267.14µs min=70.61µs p90=2.45ms p95=2.45ms
    http_req_sending.................................: avg=51.61µs max=99.78µs med=49.54µs min=25.77µs p90=99.78µs p95=99.78µs
    http_req_waiting.................................: avg=306.19ms max=309.52ms med=306.55ms min=302.61ms p90=309.52ms p95=309.52ms
    http_reqs........................................: 8 (2.6666666666666665/s)
    iterations.......................................: 4 (1.3333333333333333/s)
    vus..............................................: 1
    vus_max..........................................: 1
サンプルコードのソースを確認すると、2つのスレッショルドが設定されていることがわかります。
一つ目は、全てのリクエストにおいて95パーセンタイルが500msec以下であることを検証しています。
二つ目は、POSTするリクエストに絞って、レスポンスタイムの最大値が1000msecを超えているかの確認をしています。
柔軟ですね![]()
import http from "k6/http";
import { check } from "k6";

/*
 * Thresholds are used to specify where a metric crosses into unacceptable
 * territory. If a threshold is crossed the test is considered a failure
 * and is marked as such by the program through a non-zero exit code.
 *
 * Thresholds are specified as part of the options structure. It's a set of
 * key/value pairs where the name specifies the metric to watch (with optional
 * tag filtering) and the values are JS expressions. Which could be a simple
 * number or involve a statistical aggregate like avg, max, percentiles etc.
 */

export let options = {
    thresholds: {
        // Declare a threshold over all HTTP response times,
        // the 95th percentile should not cross 500ms
        http_req_duration: ["p(95)<500"],

        // Declare a threshold over HTTP response times for all data points
        // where the URL tag is equal to "http://httpbin.org/post",
        // the max should not cross 1000ms
        "http_req_duration{url:http://httpbin.org/post}": ["max<1000"],
    }
};

export default function() {
    http.get("http://httpbin.org/");
    http.post("http://httpbin.org/post", {data: "some data"});
}
既存の資産を活かす
APIの検証などに、postmasnやFiddlerを使われている方は多いと思います。
k6は、postmanのコレクションをコンバートするツールや、Fiddlerのレコードをexportするextentionがあったりと、既存の資産を活かすツールも用意されているようです。
https://github.com/loadimpact/postman-to-k6
https://github.com/loadimpact/FiddlerToLoadImpact
まとめ
k6の触りの部分を紹介しました。しっかり使うにはドキュメントやソースをきっちり読み込むのは当然ですが、シンプルに作られているので直感的にサクッと検証するのに使えると思います![]()
また、CIに組み込むのもそんなに難しくなくなさそうなので、品質管理の一環としてビルドパイプラインに入れてもいいと思います。
InfluxDB + Grafanaで可視化したり、パフォーマンスデータをload impactに送信して可視化することも簡単にできるようです。
こういうツールを使えば、テストを書く文化とセットでパフォーマンスを気にする文化の醸成に役立つかもしれませんね![]()