昨今検索ログの可視化が流行っています。
ElasticsearchではElasticsearch+kibana(+fluentd)が注目されていますが、
Solrではそれに対抗するように、Solr + bananaというものが作られました。
模擬的なアクセスログを可視化すること目的にSolr + banana を簡単に説明したいと思います。
Solr
solrは最新の4.10.2を使いました。
http://ftp.riken.jp/net/apache/lucene/solr/4.10.2/
banana
bananaはここからダウンロード。
https://github.com/LucidWorks/banana
(->Download Zip)
Java
jdkは1.8.0_25を使いました。
Solr起動
パッケージを解凍後、Solrを起動します。
unzip solr-4.10.2.zip
cd solr-4.10.2/example/
java -jar start.jar
起動後下記アドレスでSolrを確認できます。
http://localhost:8983/solr/
bananaの配置
Gitの説明通りにやってみます。
https://github.com/LucidWorks/banana
Gitからダウンロードしてきたものを解凍し、solrに配置します。
unzip banana-release.zip
mv banana-release solr-4.10.2/example/solr-webapp/webapp/
下記のアドレスで確認してみましょう。
http://localhost:8983/solr/banana-release/src/index.html#/dashboard
ちょこちょこ使ってみた感じ思ったのは
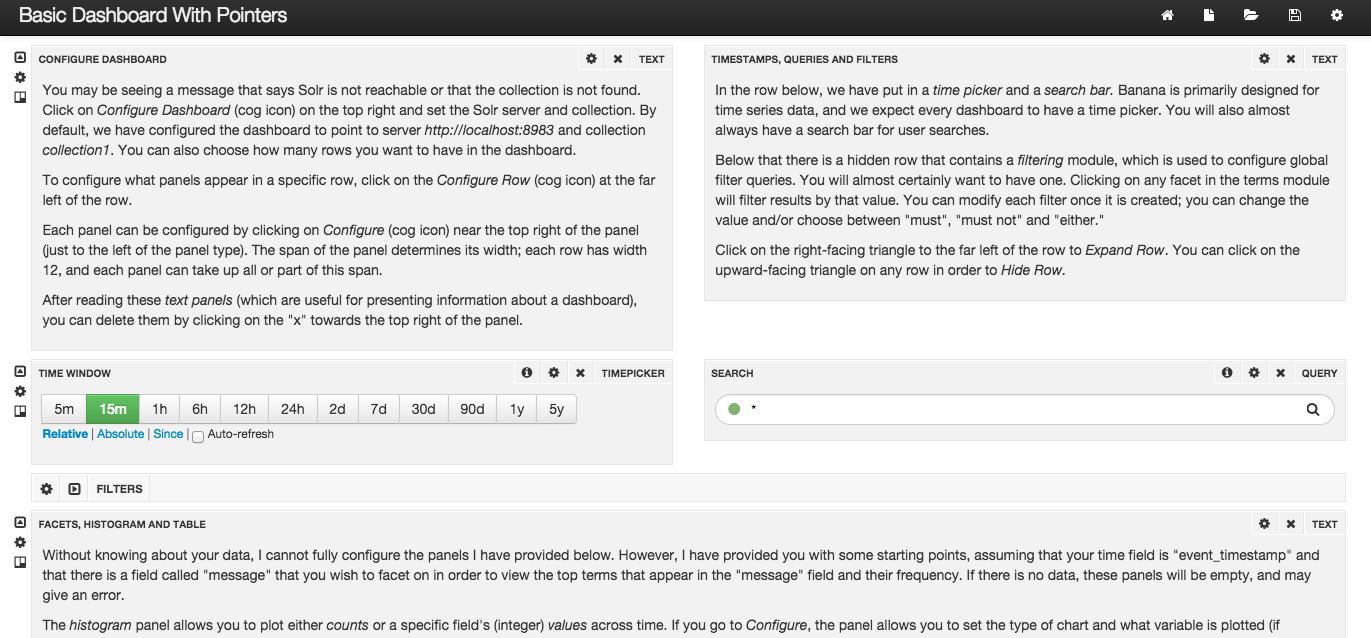
kibanaと(ほとんど)同じだ!
と思いました。(当たり前か。)
- パネルの追加方法がkibanaと同じ。
- Timepickerやテキスト表示などkibanaと同じ。
......などなど細かいところの使い方がkibanaと同じで取っ付きやすいです。
ヒストグラムを使ってみる。
普段kibanaのヒストグラムパネルを使っているので、bananaのヒストグラムを使ってみたいと思います。
ドキュメント
下記のようなサンプルのドキュメントを入れてみます。
long型とdate型のフィールドを用意し、1秒ごとのランダムで数値を入れ、
模擬的に時間ごとのアクセス数を作成し可視化してみます。
(3600秒(doc分)=1時間分入れました)
<add>
<doc>
<field name="id">test-0001</field>
<field name="count_l">13</field>
<field name="date_dt">2014-12-13T10:00:01Z</field>
</doc>
<doc>
<field name="id">test-0002</field>
<field name="count_l">17</field>
<field name="date_dt">2014-12-13T10:00:02Z</field>
</doc>
.....
更新
curl 'http://localhost:8983/solr/collection1/update?indent=true' --data-binary @docs.xml -H 'Content-Type: text/xml'
curl 'http://localhost:8983/solr/collection1/update?indent=true' --data-binary '<commit />' -H 'Content-Type: text/xml'
Timepickerの設定
Timepickerウインドウで、Absoluteを選択し12(月)/13(日)/2014(年)19:00-20:00に設定します。(時差9時間のため。日本時間に合わせるのはちょっとまだわかってません。。。)

右上の右から3番目のconfigureボタンを押して日付フィールドを設定します。
Time Fieldをdate_dtにします。

Histogramの追加
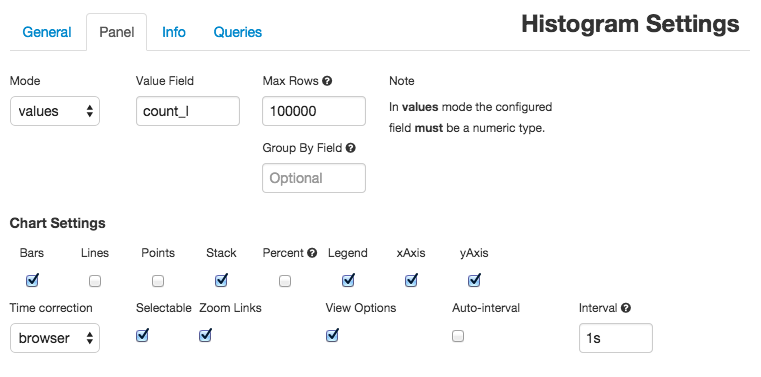
別のrowでHistogramパネルを追加します。Timepickerと同じように右上の右から3番目のconfigureボタンを押して設定します。
Mode:values、Value Field:count_l、右下のinterval:1sにします。
(1秒間隔で表示してるためか草が生えてるようにしか見えないですね。)
ヒストグラムなので、折れ線グラフ、ドットグラフも使えます。
応用すればログをパースしてさまざまなデータを表示できるでしょう。
感想
使ってみた感想ですが、
メリットとして
- kibanaよりさくさく動くのがメリット。
- 時間を広い時間にしても1秒間隔で表示できる。
(kibanaは5分などいい感じの単位でまとめられてしまう。bananaも24時間などかなり広くすると線が細すぎて見えなくなってしまいますが、その都度調整必要。) - Solrを使ってる人には使いやすい。(当たり前ですが。。)
デメリットとして
- インデックスが分けられない。(elasticの場合はその度ごとにインデックスが分けられていいですね。collectionを分ければいいのかな?)
ちょっと簡単にしかメリットデメリットあげられませんでした。


