R では他の言語を用いて mongo に格納されたデータを扱うケースが多いと思われるが, 今回は mongo からデータを取得して, R のデータ構造に変換し, プロットを行うところまでを行う.
今回使うパッケージは rmongodb にした.
RMongo というライブラリもある.
インストール
install.packages("rmongodb")
ライブラリを読み込みインスタンスを作成する
library(rmongodb)
m <- mongo.create()
接続の確認
mongo.is.connected(mongo インスタンス) は boolean が返ってくる.
connect <- mongo.is.connected(m)
print(connect)
データベースや collection 名を取得する
mongo.get.databases(mongo インスタンス) はデータベース名の list を返す.
mongo.get.database.collections(mongo インスタンス, データベース名) は, 指定したデータベースの中にある collection 名の list を返す.
databases <- mongo.get.databases(m)
print(databases)
collections <- mongo.get.database.collections(m, databases[3])
print(collections)
データベースからデータを取得する
今回は bson で取得されたデータを list に変換し, それを更に results list に格納する.
cursor <- mongo.find(m, collections[4])
tweets <- list()
while(mongo.cursor.next(cursor)) {
  v <- mongo.cursor.value(cursor)
  l <- mongo.bson.to.list(v)
  tweets[[length(tweets) + 1]] <- l
}
データをプロットする
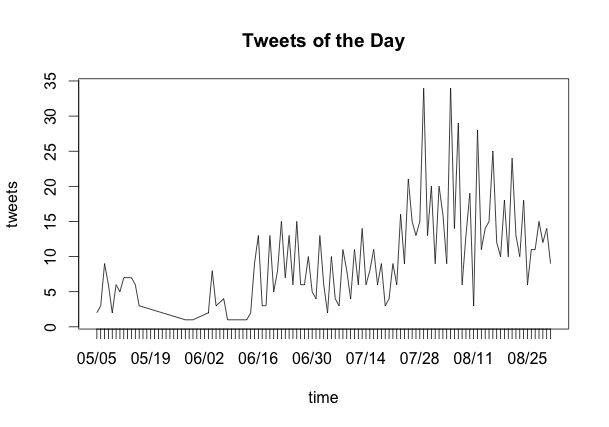
今回は取得した tweet を日別のツイート数に直し, それを plot する.
Sys.setlocale("LC_TIME", "C")
created_at <- function(l) as.Date(l$created_at, format="%a %b %d %H:%M:%S %z %Y")
time_lapse <- lapply(tweets, created_at)
x <- c()
y <- list()
for (time in time_lapse) {
  if (time %in% x) {
    now_count <- y[[length(y)]]
    y[[length(y)]] <- now_count + 1
  } else {
    x <- c(append(x, time))
    y[[length(y) + 1]] <- 1
  }
}
par(xaxt="n")
plot(x, y, main = "Tweets of the Day",xlab = "time", ylab = "tweets", type = "l")
par(xaxt="s")
axis.Date(1, at = seq(min(x),max(x), by="days"), "months", format="%m/%d")
