LoginSignup
54
53

More than 5 years have passed since last update.

Matplotlibによるヒストグラム透明重ね書き

Last updated at Posted at 2014-01-07

Pythonにおいてmatplotlibを使って透明なヒストグラムを重ね書きする.

histgram.py
import numpy as np
import matplotlib.pyplot as plt
a = np.random.randn(10000)
plt.figure()
plt.hist(a-1, bins=100, alpha=0.3, histtype='stepfilled', color='r')
plt.hist(a+1, bins=100, alpha=0.3, histtype='stepfilled', color='b')
plt.show()

alphaで透明度を調整できます.0で完全に透明.1で透明度0.
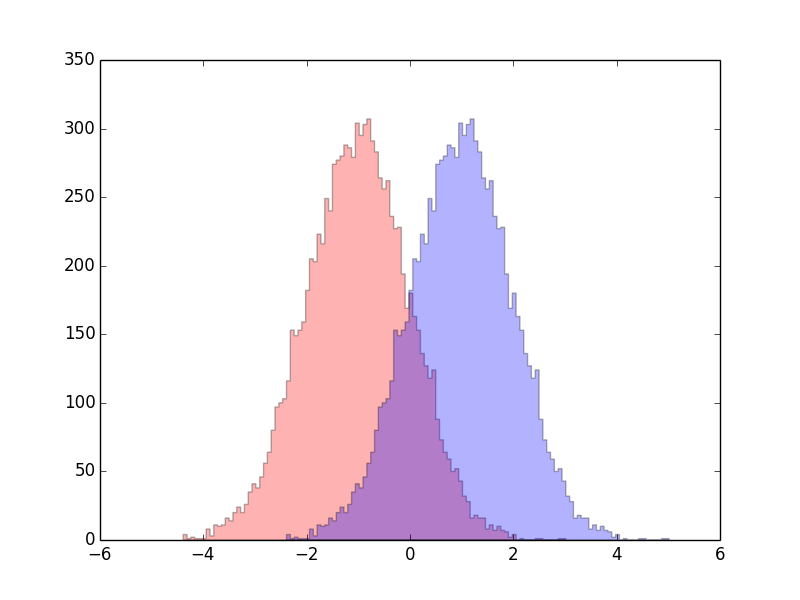
実行結果
hist.png

54
53
0

Register as a new user and use Qiita more conveniently

  1. You get articles that match your needs
  2. You can efficiently read back useful information
  3. You can use dark theme
What you can do with signing up
54
53