RでTopological data analysis
mclustのdiabeesデータを試してみる。
filter functionは以下のようにしてみた
f(x)=\sum_y exp\frac{-(distance(y-x))^2}{\epsilon}
(\epsilon=130000)
library(mclust)
library(TDAmapper)
library(igraph)

data(diabetes)
.data <- diabetes[,2:4]
.dist <- dist(.data, diag=T, upper=T)
.mat <- as.matrix(.dist)
.kernel <- function(d) sum(exp(-(d^2)/130000))
.filter <- apply(.mat, 2, .kernel)

#
map <- mapper1D(.dist, filter=.filter, num_intervals=5, percent_overlap = 50)
g <- graph.adjacency(map$adjacency, mode="undirected")

#ノード内のデータ数に応じてノードサイズを変更
V(g)$size <- 5*sqrt(sapply(map$points_in_vertex, length))

.col <- c()
N <- length(V(g))
for(i in 1:N){
  tmp <- as.numeric((table(diabetes[map$points_in_vertex[[i]], 1])))
  t <- tmp/sum(tmp)
  .col[i] <- rgb(t[1], t[2], t[3])
}
V(g)$color <- .col
plot(g)
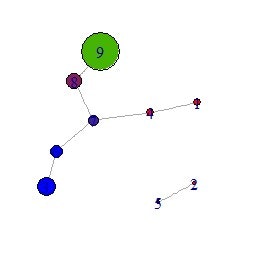
> pv <- map$points_in_vertex
> labels <- diabetes[,1]
> glucose <- diabetes[,2]
> insulin <- diabetes[,3]
> sspg <- diabetes[,4]

> rbind(
+   table(labels[pv[[9]]]),
+   table(labels[pv[[1]]]),
+   table(labels[pv[[3]]])
+ )
     Chemical Normal Overt
[1,]       29     75     2
[2,]        4      0     0
[3,]        0      0    26

> summary(diabetes[map$points_in_vertex[[9]], 2:4])
    glucose          insulin           sspg
 Min.   : 70.00   Min.   :269.0   Min.   : 73.0
 1st Qu.: 87.25   1st Qu.:333.2   1st Qu.:131.2
 Median : 93.00   Median :372.0   Median :167.0
 Mean   : 94.27   Mean   :392.6   Mean   :183.2
 3rd Qu.: 99.75   3rd Qu.:428.2   3rd Qu.:221.0
 Max.   :140.00   Max.   :643.0   Max.   :408.0
> summary(diabetes[map$points_in_vertex[[1]], 2:4])
    glucose         insulin           sspg
 Min.   : 95.0   Min.   :469.0   Min.   :564.0
 1st Qu.: 99.5   1st Qu.:505.0   1st Qu.:596.2
 Median :102.0   Median :527.0   Median :614.5
 Mean   :102.5   Mean   :520.2   Mean   :635.2
 3rd Qu.:105.0   3rd Qu.:542.2   3rd Qu.:653.5
 Max.   :111.0   Max.   :558.0   Max.   :748.0
> summary(diabetes[map$points_in_vertex[[3]], 2:4])
    glucose         insulin            sspg
 Min.   :146.0   Min.   : 832.0   Min.   : 10.00
 1st Qu.:188.5   1st Qu.: 931.8   1st Qu.: 41.25
 Median :224.5   Median :1123.0   Median : 76.50
 Mean   :241.7   Mean   :1152.9   Mean   : 75.69
 3rd Qu.:302.2   3rd Qu.:1370.8   3rd Qu.:102.75
 Max.   :353.0   Max.   :1568.0   Max.   :160.00
もう少しchemicalの分離をよくしたいが、一応overtとその他の分類はできている。