Graphvizというテキストをグラフに変換するツールをPython3から使って木構造を描画したと思います.
Graphvizとは
Graphvizは.dotという独自形式を使ってテキストをグラフに変換するツールです.
sample.dot
digraph {
    node [shape=circle]
    A [label=A]
    B [label=B]
    C [label=C]
        A -> B
        A -> C
}
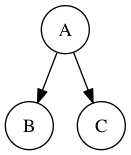
上記のサンプルから以下のようなグラフが描けます.
今回は,このGraphvizをPython3から使って木構造を描画したと思います.
動作環境
- python 3.4.2
環境構築
まずはGraphvizをbrewを使ってインストール
$brew install graphviz
$dot -V
>>> dot - graphviz version 2.38.0 (20140413.2041)
pipでgraphvizをインストール
graphvizはGraphvizをPythonから使えるようにwrapしたパッケージです.
$pip install graphviz
同じようなパッケージとしてnetworkxとの連携もできるpygraphvizがありますが,こちらは,Python3に未対応です...
基本操作
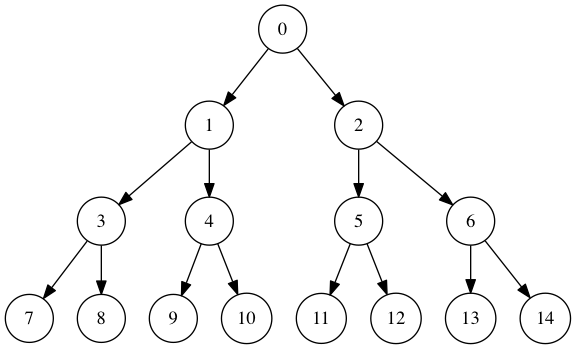
例として二分木を書いてみます.
binary_tree.py
# !/usr/bin/env python
# -*- coding: utf-8 -*-

from graphviz import Digraph

# formatはpngを指定(他にはPDF, PNG, SVGなどが指定可)
G = Digraph(format='png')
G.attr('node', shape='circle')

N = 15    # ノード数

# ノードの追加
for i in range(N):
    G.node(str(i), str(i))

# 辺の追加
for i in range(N):
    if (i - 1) // 2 >= 0:
        G.edge(str((i - 1) // 2), str(i))

# print()するとdot形式で出力される
print(G)

# binary_tree.pngで保存
G.render('binary_tree')
出力結果

