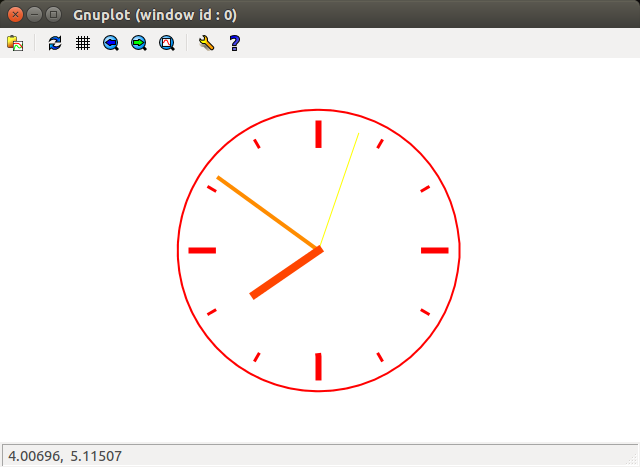
Rubyからgnuplotを操作してアナログ時計を表示します。実行すると以下のようになります。実用性... そんなものはない(画像略
ソースコード
gnuplotのバージョンは4.6、Rubyは2.2.0です。
require 'open3'

Open3.popen3('gnuplot') do |gp_in, gp_out, gp_err|
  gp_in.puts "set size square"
  gp_in.puts "set xrange [-5:5]"
  gp_in.puts "set yrange [-5:5]"
  gp_in.puts "set parametric"
  gp_in.puts "set obj rect behind " <<
    "from screen 0, screen 0 to screen 1, screen 1 " <<
    "fillcolor rgb 'black'"

  Signal.trap(:INT) do
    gp_in.close
    print gp_err.read
    exit 0
  end

  loop do
    plot = "plot "

    # 時計の外周の円
    plot << "4*cos(t), 4*sin(t) notitle lw 2 lc rgb 'red',\\\n"

    # 時計の文字盤
    12.times do |h|
      plot << "'-' notitle with lines lw #{h % 3 == 0 ? 6 : 3} lc rgb 'red',\\\n"
    end

    plot << "'-' notitle with lines lw 1 lc rgb 'yellow',\\\n"  # 秒針
    plot << "'-' notitle with lines lw 4 lc rgb '#ff8c00',\\\n" # 長針
    plot << "'-' notitle with lines lw 8 lc rgb '#ff4500',\\\n" # 短針
    plot.gsub!(/,\\\n\z/, "\n")

    # 時計の文字盤
    12.times do |h|
      if h % 3 == 0
        plot << "#{3.0*Math.cos(Math::PI*(h/6.0))}, #{3.0*Math.sin(Math::PI*(h/6.0))}\n"
      else
        plot << "#{3.4*Math.cos(Math::PI*(h/6.0))}, #{3.4*Math.sin(Math::PI*(h/6.0))}\n"
      end
      plot << "#{3.6*Math.cos(Math::PI*(h/6.0))}, #{3.6*Math.sin(Math::PI*(h/6.0))}\n"
      plot << "e\n"
    end

    # 現在時刻を取得
    h, m, s = Time.now.strftime('%H%M%S').scan(/../).map(&:to_i)
    s = 75 - s
    h = 75 - (h + m / 60.0)
    m = 75 - m

    plot << "0, 0\n" # 秒針
    plot << "#{3.7*Math.cos(Math::PI*(s/30.0))}, #{3.5*Math.sin(Math::PI*(s/30.0))}\ne\n"
    plot << "0, 0\n" # 長針
    plot << "#{3.5*Math.cos(Math::PI*(m/30.0))}, #{3.5*Math.sin(Math::PI*(m/30.0))}\ne\n"
    plot << "0, 0\n" # 短針
    plot << "#{2.2*Math.cos(Math::PI*(h/6.0))}, #{2.2*Math.sin(Math::PI*(h/6.0))}\ne\n"
    gp_in.puts plot
    sleep 0.3
  end

  gp_in.puts "exit"
  gp_in.close
end
補足
set obj ... の部分で画面全体に黒い四角を置き、同じ黒色のx軸やy軸を見えないようにしています。見た目もかっこよくなって一石二鳥。
set obj ... を使わない場合は、代わりに
gp_in.puts "set border lc rgb 'white'"
あるいは
  gp_in.puts "unset border"
  gp_in.puts "unset xtics"
  gp_in.puts "unset ytics"
という行を追加すると、軸が消えて以下のように同じく時計だけ表示されます。ただこのままだとちょっと見づらいので、秒針とかの色を変更する必要がありそうです。
おわりに
gnuplot力が足りないのでRubyと組合せましたが、調べたらgnuplotだけで時計表示している人もいました。(参考ページふたつめのリンク)