この記事について
Pythonでファイナンス関係の情報を探していたところ見つけた"Quantopian"が面白そうだったので試してみます。
Quantopian
Quantopianとは
クラウドベースのアルゴリズムトレーディングプラットフォームです。ユーザはブラウザで専用のIDE(開発環境)を使ってPythonライクなコードでトレーディングアルゴリズムを作成し、バックテストを行うことができます。Interactive Brokers証券に口座がある場合は、接続してリアルトレードを行うこともできるようです。
何がトレードできる?
2002年以降の米国株/ETFのデータを分足ベースで保持しているようです。
はじめよう
アカウント登録
サイトにアクセスします。真っ赤です。右上のSign Upからメールアドレスで登録します。

ログイン直後
Capital -> Leaderboardから開催中/開催予定のContest(フォワードテスト)を見ることができます。Contestは6ヶ月区切りで開催されているようですね。
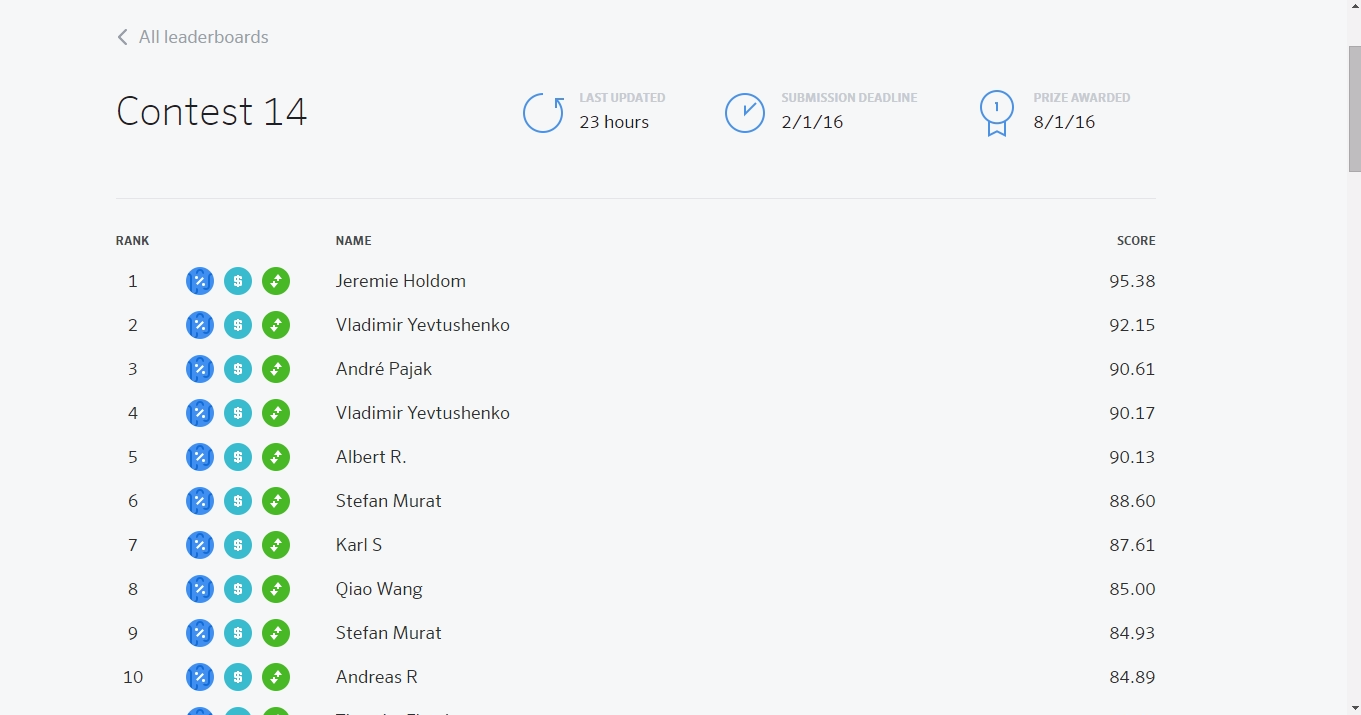
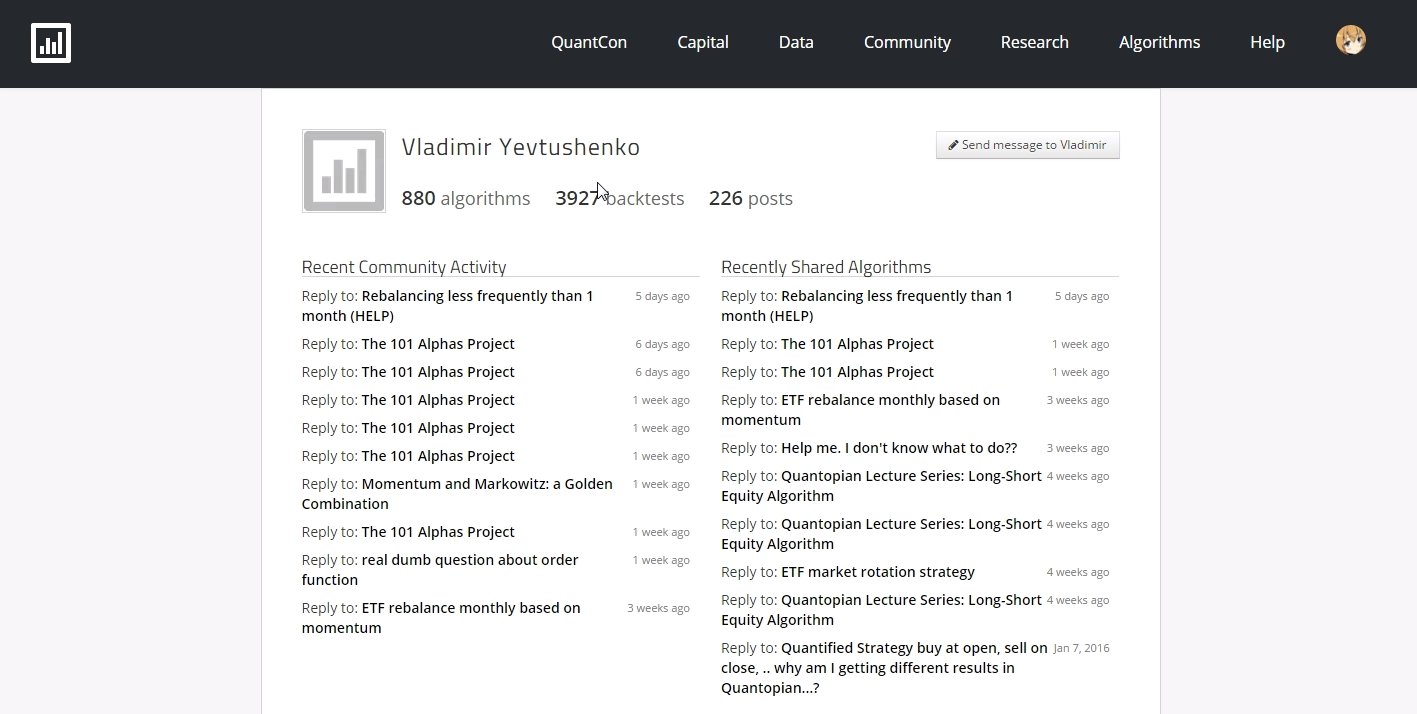
名前を辿って行くと、その人がCommunityに投稿した内容や、shareしたAlgorithmを見ることができます。
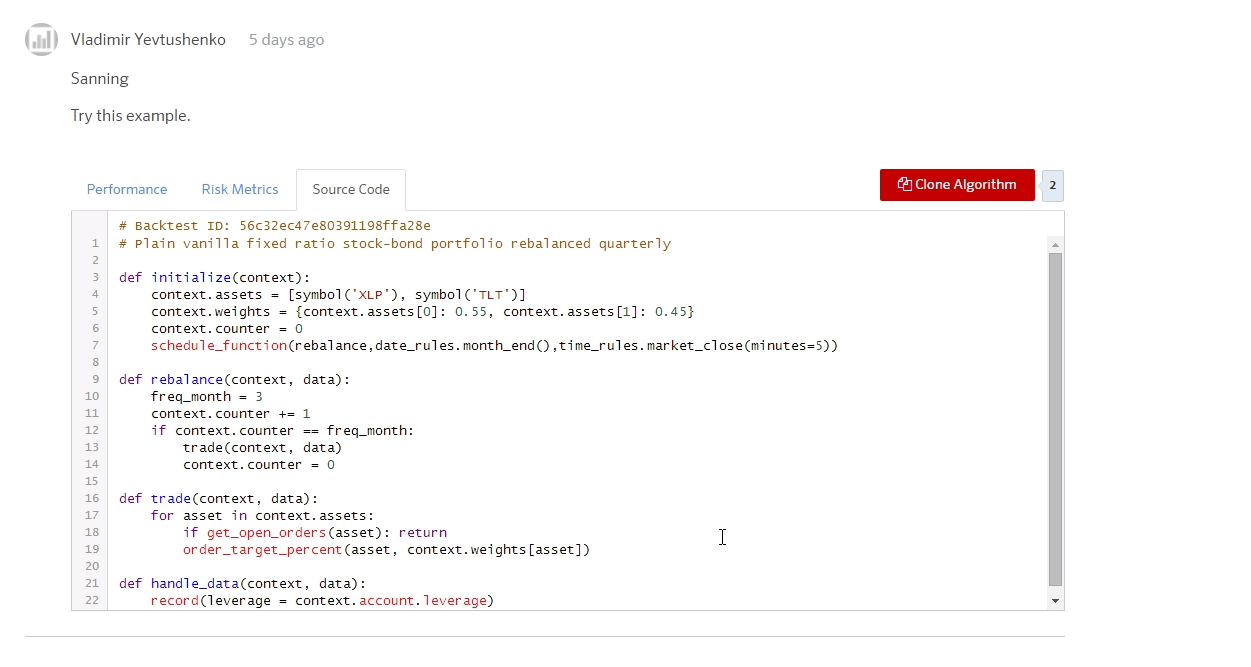
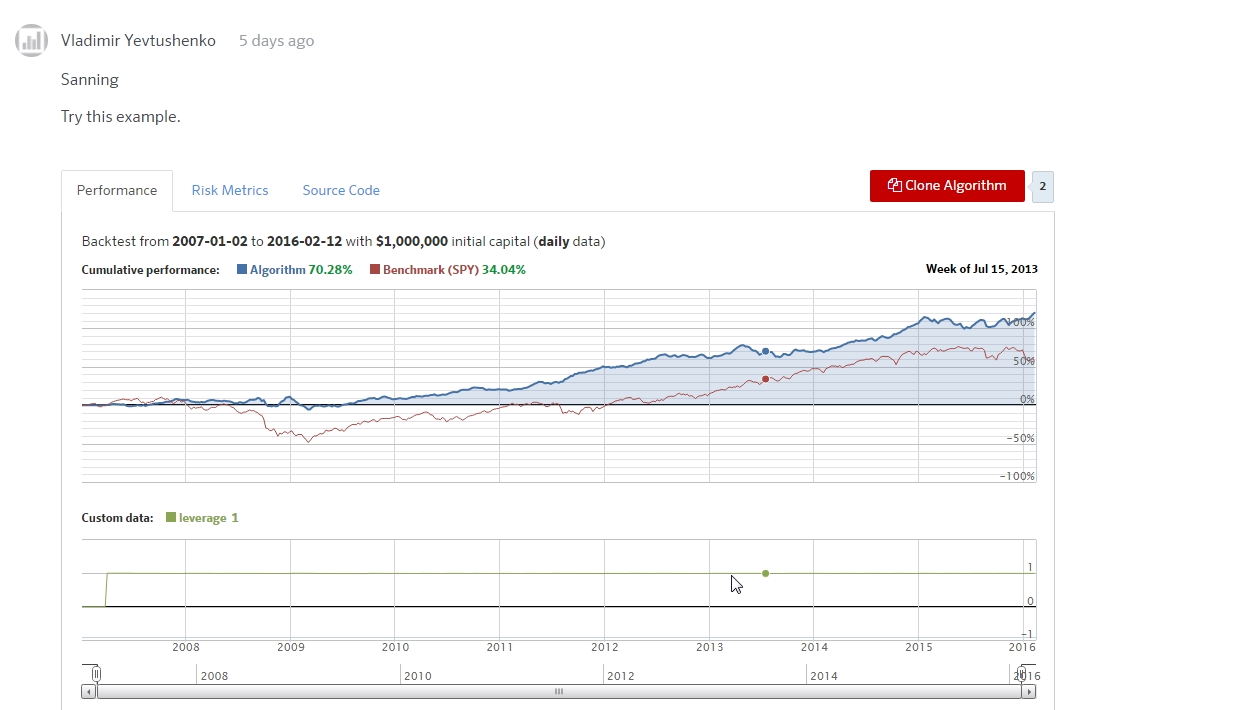
shareされたAlgorithmのパフォーマンスやソースコードを見たり、Cloneして改良することもできます。このへんはGitHubっぽいですね。
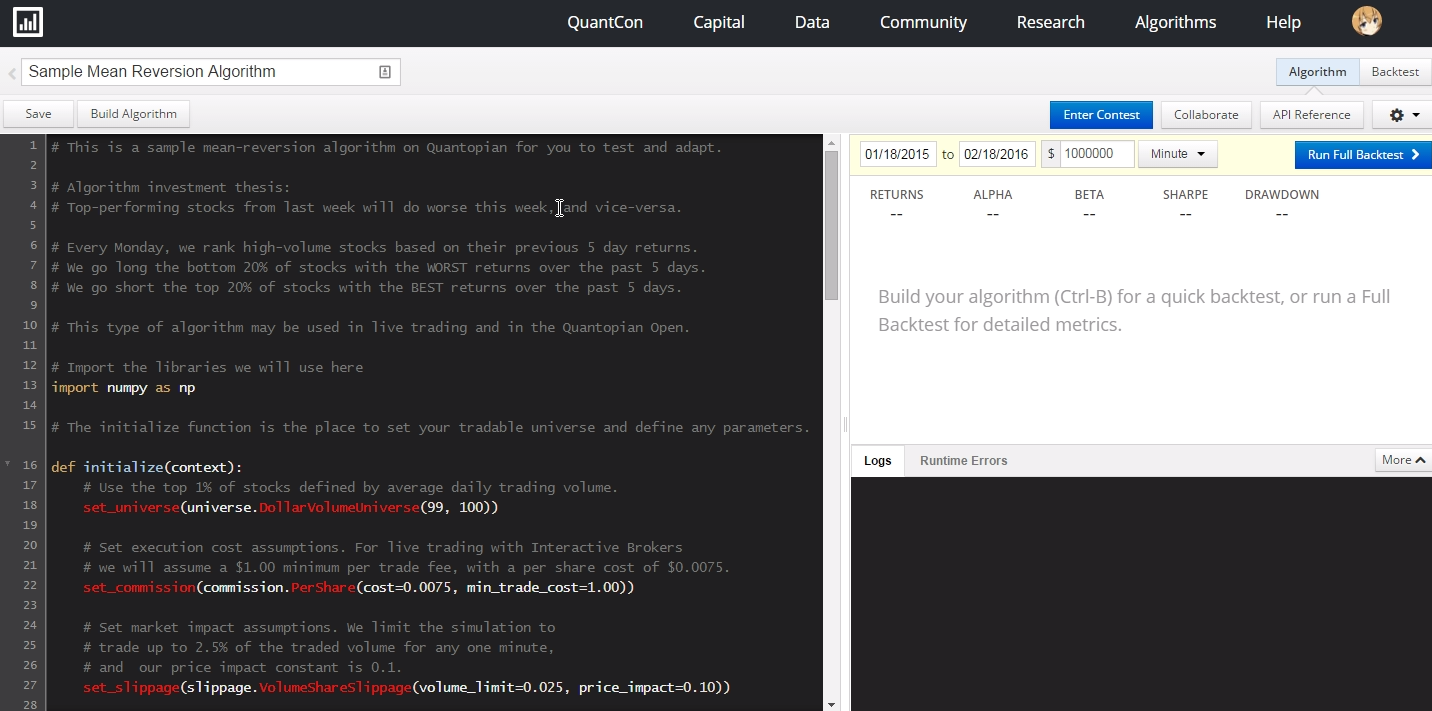
アルゴリズムのコーディングはAlgorithmから行います。
コードはどう書くの?
サンプルのSample Mean Reversion Algorithmを読んでみましょう。以下、コード全文をとりあえず掲載しておきます。
# This is a sample mean-reversion algorithm on Quantopian for you to test and adapt.

# Algorithm investment thesis:
# Top-performing stocks from last week will do worse this week, and vice-versa.

# Every Monday, we rank high-volume stocks based on their previous 5 day returns.
# We go long the bottom 20% of stocks with the WORST returns over the past 5 days.
# We go short the top 20% of stocks with the BEST returns over the past 5 days.

# This type of algorithm may be used in live trading and in the Quantopian Open.

# Import the libraries we will use here
import numpy as np

# The initialize function is the place to set your tradable universe and define any parameters.
def initialize(context):
    # Use the top 1% of stocks defined by average daily trading volume.
    set_universe(universe.DollarVolumeUniverse(99, 100))

    # Set execution cost assumptions. For live trading with Interactive Brokers
    # we will assume a $1.00 minimum per trade fee, with a per share cost of $0.0075.
    set_commission(commission.PerShare(cost=0.0075, min_trade_cost=1.00))

    # Set market impact assumptions. We limit the simulation to
    # trade up to 2.5% of the traded volume for any one minute,
    # and  our price impact constant is 0.1.
    set_slippage(slippage.VolumeShareSlippage(volume_limit=0.025, price_impact=0.10))

    # Define the other variables
    context.long_leverage = 0.5
    context.short_leverage = -0.5
    context.lower_percentile = 20
    context.upper_percentile = 80
    context.returns_lookback = 5

    # Rebalance every Monday (or the first trading day if it's a holiday).
    # At 11AM ET, which is 1 hour and 30 minutes after market open.
    schedule_function(rebalance,
                      date_rules.week_start(days_offset=0),
                      time_rules.market_open(hours = 1, minutes = 30))

# The handle_data function is run every bar.
def handle_data(context,data):
    # Record and plot the leverage of our portfolio over time.
    record(leverage = context.account.leverage)

    # We also want to monitor the number of long and short positions
    # in our portfolio over time. This loop will check our positition sizes
    # and add the count of longs and shorts to our plot.
    longs = shorts = 0
    for position in context.portfolio.positions.itervalues():
        if position.amount > 0:
            longs += 1
        if position.amount < 0:
            shorts += 1
    record(long_count=longs, short_count=shorts)

# This rebalancing is called according to our schedule_function settings.
def rebalance(context,data):
    # Get the last N days of prices for every stock in our universe.
    prices = history(context.returns_lookback, '1d', 'price')

    # Calculate the past 5 days' returns for each security.
    returns = (prices.iloc[-1] - prices.iloc[0]) / prices.iloc[0]

    # Remove stocks with missing prices.
    # Remove any stocks we ordered last time that still have open orders.
    # Get the cutoff return percentiles for the long and short portfolios.
    returns = returns.dropna()
    open_orders = get_open_orders()
    if open_orders:
        eligible_secs = [sec for sec in data if sec not in open_orders]
        returns = returns[eligible_secs]

    # Lower percentile is the threshhold for the bottom 20%, upper percentile is for the top 20%.
    lower, upper = np.percentile(returns, [context.lower_percentile,
                                           context.upper_percentile])

    # Select the X% worst performing securities to go long.
    long_secs = returns[returns <= lower]

    # Select the Y% best performing securities to short.
    short_secs = returns[returns >= upper]

    # Set the allocations to even weights in each portfolio.
    long_weight = context.long_leverage / len(long_secs)
    short_weight = context.short_leverage / len(short_secs)

    for security in data:

        # Buy/rebalance securities in the long leg of our portfolio.
        if security in long_secs:
            order_target_percent(security, long_weight)

        # Sell/rebalance securities in the short leg of our portfolio.
        elif security in short_secs:
            order_target_percent(security, short_weight)

        # Close any positions that fell out of the list of securities to long or short.
        else:
            order_target(security, 0)

    log.info("This week's longs: "+", ".join([long_.symbol for long_ in long_secs.index]))
    log.info("This week's shorts: "  +", ".join([short_.symbol for short_ in short_secs.index]))
概要
サンプルのアルゴリズムはいわゆる「リターン・リバーサル」(平均回帰の法則により、相対的に下がったものは上がり、逆に上がったものは下がる現象)を狙ったものです。戦略は以下のとおり。
- 毎週初めに、取引金額の多い株式について過去5日のリターンを計測する
- リターン下位20%の株式をロングする
- リターン上位20%の株式をショートする
- ロングにもショートにもならなかった銘柄は手仕舞う
- ロング、ショートとも持ち高は資金の50%とする
initialize(context)
お約束として最初に書きます。contextはトレードセッションの間、パラメータ等を管理する役割を持ちます。つまりグローバル変数のような働きです。パラメータについてはcontext.some_propertyのような感じで設定します。
    # Use the top 1% of stocks defined by average daily trading volume.
    set_universe(universe.DollarVolumeUniverse(99, 100))
まず投資ユニバースを定義します。取引金額のパーセンタイルランクのうち99~100%を取得しています。つまり取引金額上位1%です。
    # Set execution cost assumptions. For live trading with Interactive Brokers
    # we will assume a $1.00 minimum per trade fee, with a per share cost of $0.0075.
    set_commission(commission.PerShare(cost=0.0075, min_trade_cost=1.00))
手数料は1株0.75セント、最低1ドルとします。
    # Set market impact assumptions. We limit the simulation to
    # trade up to 2.5% of the traded volume for any one minute,
    # and  our price impact constant is 0.1.
    set_slippage(slippage.VolumeShareSlippage(volume_limit=0.025, price_impact=0.10))
スリッページおよびマーケットインパクトの影響を定義します。volume_limit=は分足ベースの出来高に対して自分の注文数量をどの程度に抑えるかというもので、例えば分足ベースで100株が取引されている時にvolume_limit=0.25とすると、1本の分足に対しては25株(1000.25)まで約定できるというふうに計算されます。
実際のマーケットインパクト(自分の注文による価格変動)はprice_impact=定数を用いて計算されます。Quantopianではマーケットインパクトは(自分の注文/出来高)^2定数で算出され、例えば上記の例だと自分の注文によって(0.25)^2*0.10=0.625%ぶん、価格が不利な方向に動くこととなります。
    # Define the other variables
    context.long_leverage = 0.5
    context.short_leverage = -0.5
    context.lower_percentile = 20
    context.upper_percentile = 80
    context.returns_lookback = 5
トレーディングセッションで使用する定数の定義です。ロング/ショートとも持ち高は資金の50%まで、下位/上位のパーセンタイル水準、過去リターン計測期間を定義しています。
    # Rebalance every Monday (or the first trading day if it's a holiday).
    # At 11AM ET, which is 1 hour and 30 minutes after market open.
    schedule_function(rebalance,
                      date_rules.week_start(days_offset=0),
                      time_rules.market_open(hours = 1, minutes = 30))
定期的に実行する処理を記述します。週の初めの日の、開場から1時間30分後にrebalanceファンクションが呼び出されます。(米国株の立会時間は9:30~16:00なので、11:00に実行されるということ)
handle_data(context, data)
トレードイベント(バーの更新)が発生するたびに呼び出されます。dataは投資ユニバースデータを格納したもので、テシッカーシンボルがkeyとなる辞書です。例えばdata[symbol('GOOG')]のようにすると、最新のGoogleのデータを取得します。
# The handle_data function is run every bar.
def handle_data(context,data):
    # Record and plot the leverage of our portfolio over time.
    record(leverage = context.account.leverage)

    # We also want to monitor the number of long and short positions
    # in our portfolio over time. This loop will check our positition sizes
    # and add the count of longs and shorts to our plot.
    longs = shorts = 0
    for position in context.portfolio.positions.itervalues():
        if position.amount > 0:
            longs += 1
        if position.amount < 0:
            shorts += 1
    record(long_count=longs, short_count=shorts)
record()を使用すると、任意の値を記録してチャートに出力できるようになります。この場合、レバレッジとロング・ショートの銘柄数を記録し、プロットできるようにしています。
rebalance(context,data)
schedule_functionによって呼び出され、仕掛け・手仕舞いはここで実行されます。
# This rebalancing is called according to our schedule_function settings.
def rebalance(context,data):
    # Get the last N days of prices for every stock in our universe.
    prices = history(context.returns_lookback, '1d', 'price')
historyは組み込み関数で、history(bar_count, frequency, field, ffill=True)と指定します。bar_countで現在の足を含む位置を指定し、frequencyで間隔、fieldで取得するデータを指定します。この場合、5日前の価格を取得します。戻り値はpandas.DataFrame形式で、columns方向にユニバースの銘柄が並んだデータとなります。
    # Calculate the past 5 days' returns for each security.
    returns = (prices.iloc[-1] - prices.iloc[0]) / prices.iloc[0]
リターン計算を行います。
    # Remove stocks with missing prices.
    # Remove any stocks we ordered last time that still have open orders.
    # Get the cutoff return percentiles for the long and short portfolios.
    returns = returns.dropna()
    open_orders = get_open_orders()
    if open_orders:
        eligible_secs = [sec for sec in data if sec not in open_orders]
        returns = returns[eligible_secs]
計算不能なリターンを除いたうえで、トレード中の銘柄を除いたものをトレード適格な銘柄とみなします。
    # Lower percentile is the threshhold for the bottom 20%, upper percentile is for the top 20%.
    lower, upper = np.percentile(returns, [context.lower_percentile,
                                           context.upper_percentile])

    # Select the X% worst performing securities to go long.
    long_secs = returns[returns <= lower]

    # Select the Y% best performing securities to short.
    short_secs = returns[returns >= upper]
lower, upperに下位20%点、上位20%点のリターンを代入し、元のreturnsをフィルタしてロング銘柄とショート銘柄に絞ります。
    # Set the allocations to even weights in each portfolio.
    long_weight = context.long_leverage / len(long_secs)
    short_weight = context.short_leverage / len(short_secs)
ロング、ショート別に、1銘柄あたりのポジション規模を決定します。ロング銘柄が5つであれば、銘柄毎には資金量の0.1倍のポジションが許容されるということですね。
    for security in data:

        # Buy/rebalance securities in the long leg of our portfolio.
        if security in long_secs:
            order_target_percent(security, long_weight)

        # Sell/rebalance securities in the short leg of our portfolio.
        elif security in short_secs:
            order_target_percent(security, short_weight)

        # Close any positions that fell out of the list of securities to long or short.
        else:
            order_target(security, 0)

    log.info("This week's longs: "+", ".join([long_.symbol for long_ in long_secs.index]))
    log.info("This week's shorts: "  +", ".join([short_.symbol for short_ in short_secs.index]))
すべてのユニバース銘柄について, long_secsに含まれるものとshort_secsに含まれるものを発注していきます。order_target_percentは組み込み関数で、指定した銘柄がポートフォリオの指定したウェイトになるように発注するものです。例えば既にAAPLがポートフォリオの5%あるときに、order_target_percent(symbol('AAPL'), 0.1)を実行すると、差分の5%分の購入が行われます。こういうところ、賢い!
long_secsにもshort_secsにも含まれない銘柄はウェイト0%つまり手仕舞われます。
最後にログを出力して終了。
バックテストを走らせてみよう
エディタ画面でCtrl+Bを押すと簡易バックテストを実行することができます。簡易とはいえ少々時間はかかります。
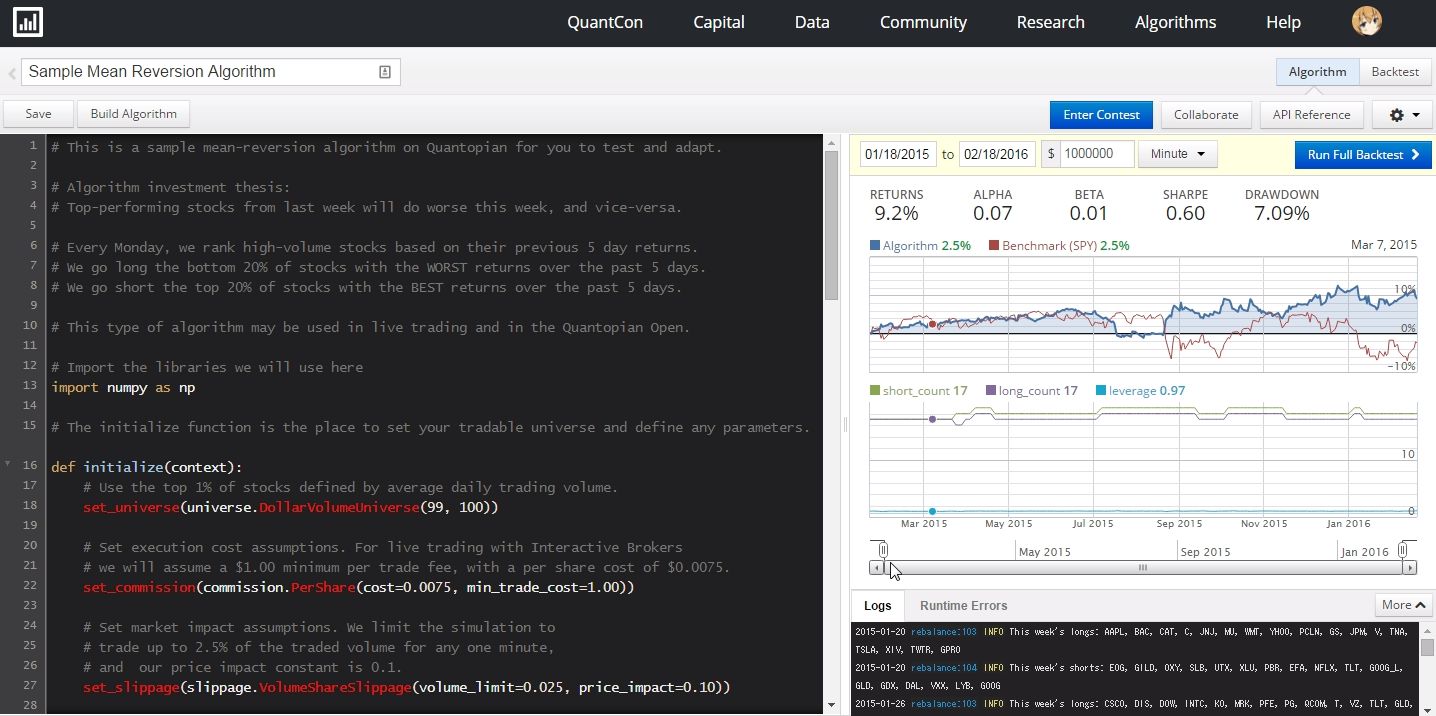
S&P500(SPY)と比較したパフォーマンスや、リターン・ベータ・ドローダウンが確認できます。ログ画面にはロング・ショートした銘柄の情報も出ています。
Full Backtestを実行するともっと詳細な検証をすることができます。(数分程度かかります)
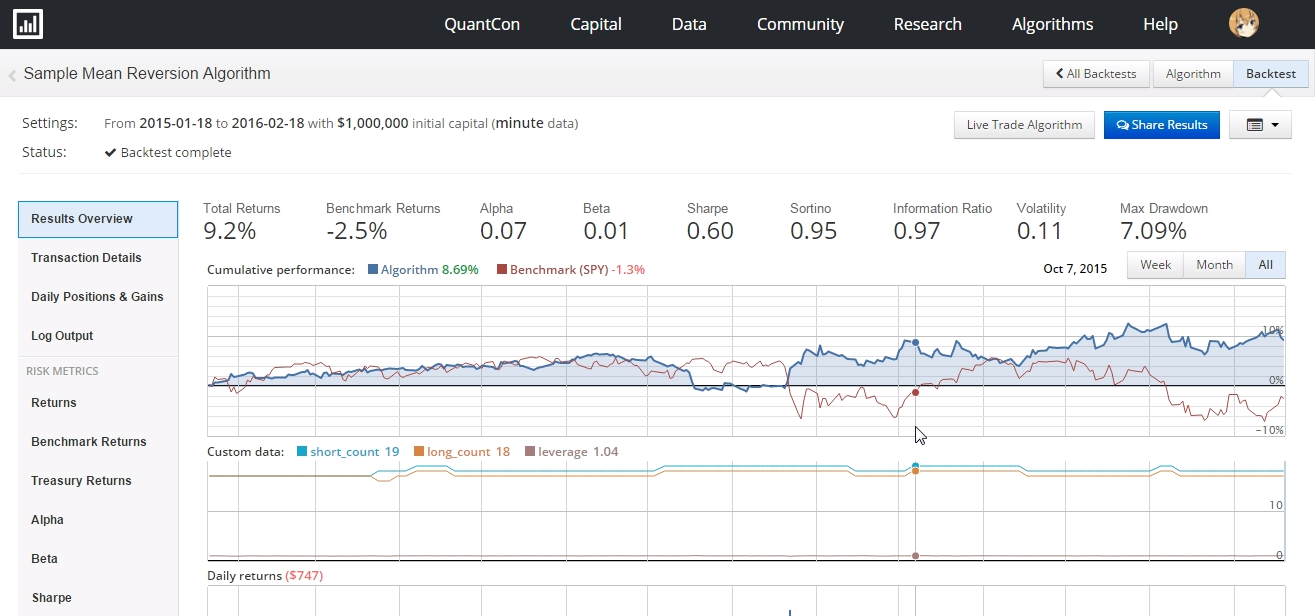
リターンは9.2%であり、SPY-2.5%に対してアウトパフォームです。この戦略はベータ0.01なのでSPYと全く連動しません。最大ドローダウンは7%程度でした。シャープレシオ、ソルティノレシオ、インフォメーションレシオなどもわかります。
期間中のレバレッジは0.95-1.05程度で、ほぼマーケットニュートラルと言えそうです。
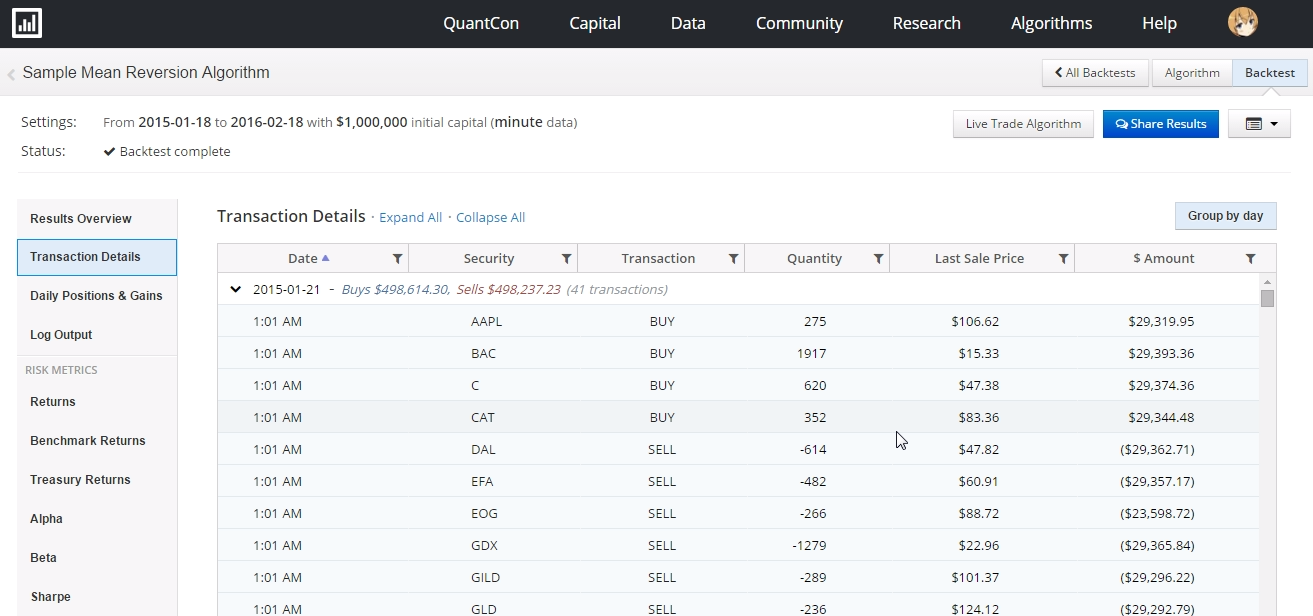
Transaction Detailsを見ると売買履歴などもわかります。
おわりに
とりあえずサンプルアルゴリズムを動かしてみただけですが、APIドキュメントなどを見るとかなり充実したアルゴリズムトレーディングプラットフォームであることがわかりました。これまでシステムトレードといえば自前でデータを収集したり、モデルを組んだり、市販ソフトを利用したりというやり方が多かったと思いますが、今後はクラウドでやる時代かもしれませんね。何より、Pythonのコーディングスキルがそのまま利用できるのが大きいと思います。
ziplineというパッケージを使うとローカル環境でも同様のことができるようですが、残念ながらlinux, OSXのみ対応なので筆者の環境にはインストールできません。
今後はAPIの読解なども進めてみたいと思います。
参考サイト
日本語の情報はまだほとんど無いようです。

