LoginSignup
42
41

More than 5 years have passed since last update.

jupyter notebook 内でのグラフ表示

Last updated at Posted at 2016-10-22

matplotlibのグラフをインラインで表示
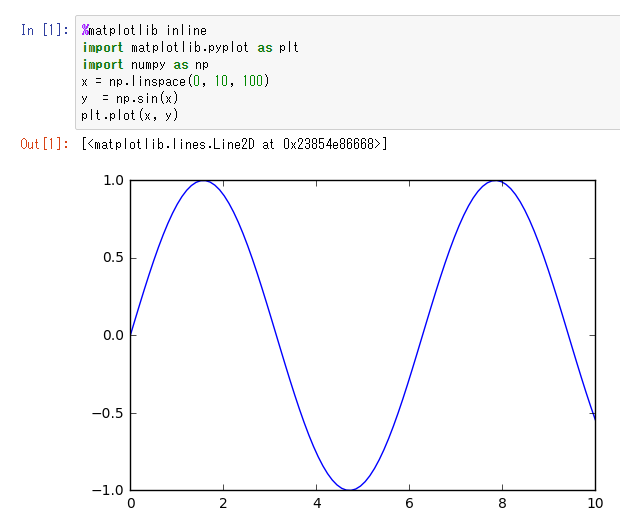
  • グラフ固定の場合
%matplotlib inline
import matplotlib.pyplot as plt
import numpy as np
x = np.linspace(0, 10, 100)
y  = np.sin(x)
plt.plot(x, y)

inline.PNG

  • グラフを移動・拡大縮小したい場合
%matplotlib notebook
import matplotlib.pyplot as plt
import numpy as np
x = np.linspace(0, 10, 100)
y  = np.sin(x)
plt.plot(x, y)

notebook.PNG

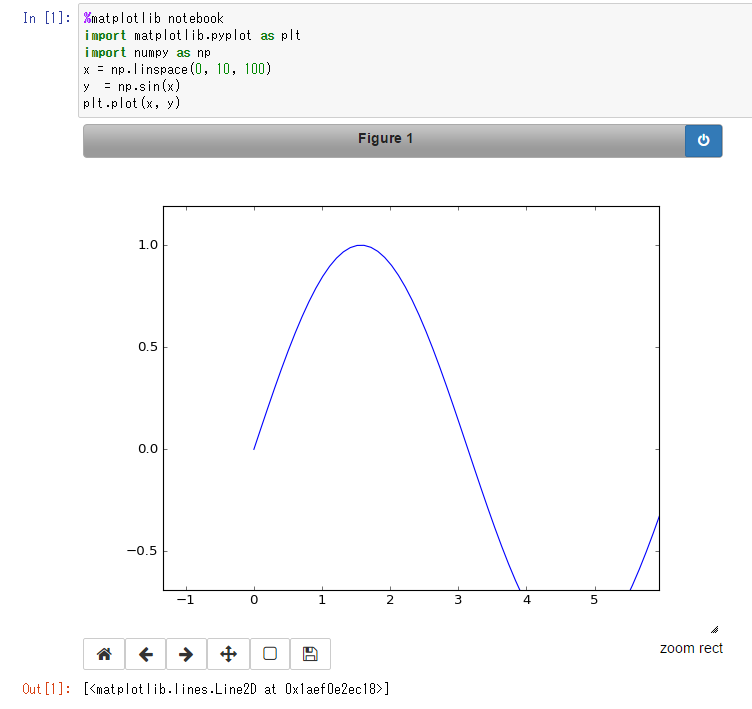
下のアイコンで移動や拡大縮小・保存ができます。

42
41
0

Register as a new user and use Qiita more conveniently

  1. You get articles that match your needs
  2. You can efficiently read back useful information
  3. You can use dark theme
What you can do with signing up
42
41