<html>
  <head>
    <meta http-equiv="Content-Type" content="text/html; charset=UTF-8">
    <script type="text/javascript" src="https://www.google.com/jsapi"></script>
    <script type="text/javascript">
      google.load("visualization", "1", {packages:["corechart"]});
      google.setOnLoadCallback(drawChart);
      function drawChart() {

        var data = google.visualization.arrayToDataTable([
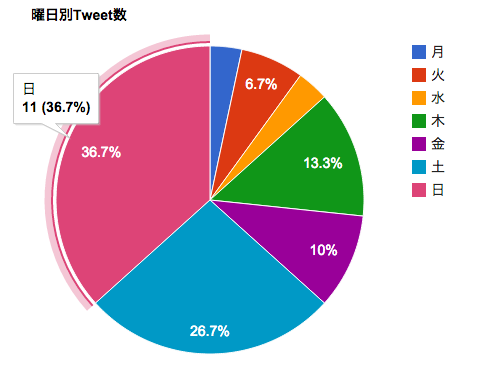
          ['曜日','ツイート数'],
          ['月',   1],
          ['火',   2],
          ['水',   1],
          ['木',   4],
          ['金',   3],
          ['土',   8],
          ['日',   11]
        ]);

        var options = {
          title: '曜日別Tweet数'
        };

        var chart = new google.visualization.PieChart(document.getElementById('piechart'));

        chart.draw(data, options);
      }
    </script>
  </head>
  <body>
    <div id="piechart" style="width: 900px; height: 500px;"></div>
  </body>
</html>
