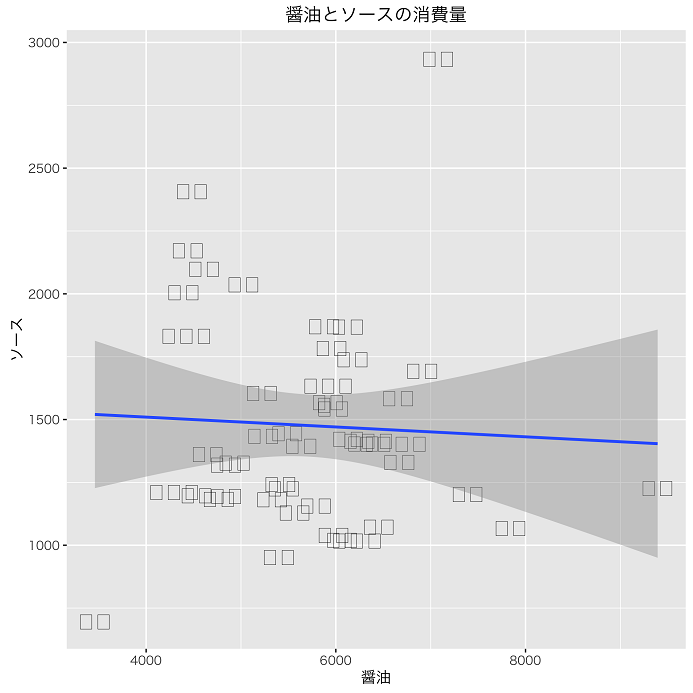
ggplot2 で日本語を使う場合は、基本的にコマンドの最後に theme_gray(base_family = "HiraKakuPro-W3") を加えれば良いが、プロット領域に日本語を表示しようとすると化けることがある。
soy <- read.csv
 ("http://web.ias.tokushima-u.ac.jp/linguistik/Book1.csv", fileEncod = "CP932")

library ("ggplot2")
ggplot (soy, aes (x = soy, y = source)) +
  geom_text(aes(label = city)) +
  xlab("醤油") + ylab ("ソース") +
  ggtitle ("醤油とソースの消費量") +
  geom_smooth(method = "lm") +
  theme_gray (base_family = "HiraKakuPro-W3")
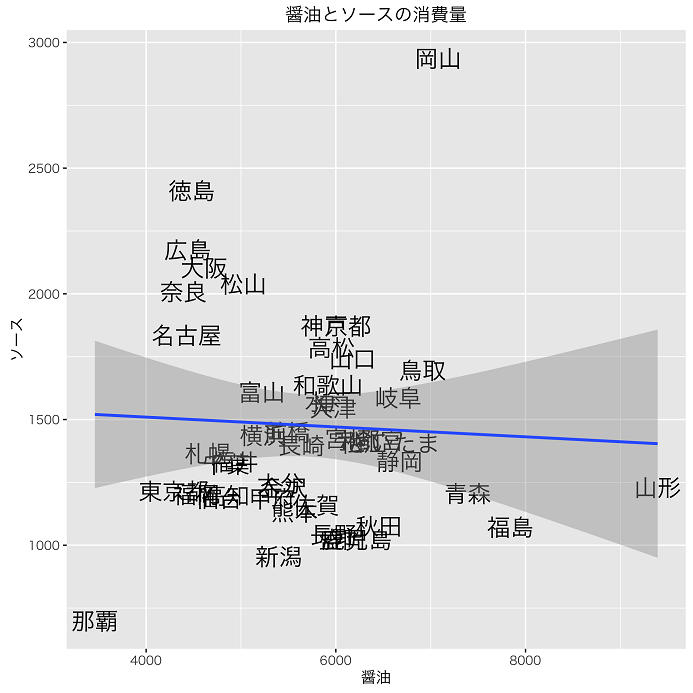
これは geom_text() に明示的にfamilyを指定しないといけないようである。多分。
ggplot (soy, aes (x = soy, y = source)) +  geom_text(aes(label = city), size = 6, family = "HiraKakuPro-W3") +
  xlab("醤油") + ylab ("ソース") +
  ggtitle ("醤油とソースの消費量") +
  geom_smooth(method = "lm") +
  theme_gray (base_family = "HiraKakuPro-W3")
徳島と岡山って、ソースを何に使っているのよ?

