以前、日本地図を描きましたが、今度は市区町村(行政区域)に分けられた都道府県の地図を描いてみます。
市区町村レベルの地図データは、国土地理院の地球地図や国土交通省の国土数値情報からダウンロードできます。
国土地理院のデータは、政令指定都市(札幌市とか)の区がわかれていなく、市区町村名もローマ字表記だったので、国土交通省の国土数値情報を使うことにしました。
行政区域データの全国を選んでダウンロードします。(都道府県別のファイルもありますが、めんどくさいので全国データから各都道府県データを抽出します。)
N03-160101_GML.zip というファイルがダウンロードされるので(めっちゃ時間かかったけど)、解凍して N03-16_160101.shp というファイルを使います。
extract_pref.sh
# ! /bin/sh

for i in `seq 1 47`
do
  if [ $i -lt 10 ]; then
    i=0$i
  fi
  ogr2ogr -f GeoJSON -where "N03_007 like '$i%'" pref/ward.json N03-16_160101.shp
  topojson -s 0.000000001 -p N03_003 -p N03_004 -p N03_007 -o pref/pref$i.json pref/ward.json
  rm pref/ward.json
done
こんな感じで都道府県別のTopoJSONファイルを47個作ります。
ちなみにN03_003とN03_004に名前が、N03_007に市区町村コードが入っています。
そのままだと細かすぎる(ファイルが大きくなって表示に時間がかかる)ので、-sオプションで少し荒くしています。
pref.html
<!DOCTYPE html>
    <html lang="ja">
      <head>
        <meta charset="utf-8">
        <title>D3 Test</title>
        <style type="text/css">
        .ward {
            fill: #fff;
            stroke: #aaa;
        }
        svg {
            background: #eff;
            padding: 40px;
        }
        </style>
      </head>
      <body>
        <script src="http://d3js.org/d3.v4.min.js"></script>
        <script src="http://d3js.org/topojson.v2.min.js"></script>
        <script type="text/javascript">
        var pref_code = location.search.match(/code=([0-9]+?)(&|$)/);
        if (pref_code) {
            pref_code = pref_code[1];
        } else {
            pref_code = '01';
        }

        var width = 960,
        height = 640,
        padding = 40;

        var svg = d3.select("body").append("svg")
            .attr("width", width)
            .attr("height", height);

        var projection = d3.geoMercator()
            .translate([width / 2, height / 2]);

        var path = d3.geoPath()
            .projection(projection);

        d3.json("pref/pref" + pref_code + ".json", function(error, pref) {
            var topo = topojson.feature(pref, pref.objects.ward);
            projection
                .center(d3.geoCentroid(topo))
                .fitSize([width, height], topo);
            svg.selectAll(".ward")
                .data(topo.features)
                .enter()
                .append("path")
                .attr("class", function(d) {
                    return "ward ward-" + d.properties.N03_007;
                })
                .attr("d", path)
                .on("mouseover", function(d) {
                    d3.selectAll(".ward-" + d.properties.N03_007).style("fill", "#f99");
                    var label = d.properties.N03_003 ? d.properties.N03_003 : '';
                    label += d.properties.N03_004 ? d.properties.N03_004 : '';
                    svg.append("text")
                        .attr("x", d3.event.offsetX - padding - 20)
                        .attr("y", d3.event.offsetY - padding - 15)
                        .attr("class", "ward-label")
                        .text(label);
                })
                .on("mouseout", function(d) {
                    d3.selectAll(".ward-" + d.properties.N03_007).style("fill", "#fff");
                    svg.select(".ward-label").remove();
                });
        });
        </script>
      </body>
</html>
d3.js バージョン4だとprojection.fitSize()でいい感じのscaleにしてくれるのが嬉しい!(scaleをどう計算したらいいのかわからなくて挫折した…)
pref.html?code=01のようにアクセスすると北海道の地図が表示されて、マウスオーバーで市区町村名が出ます。
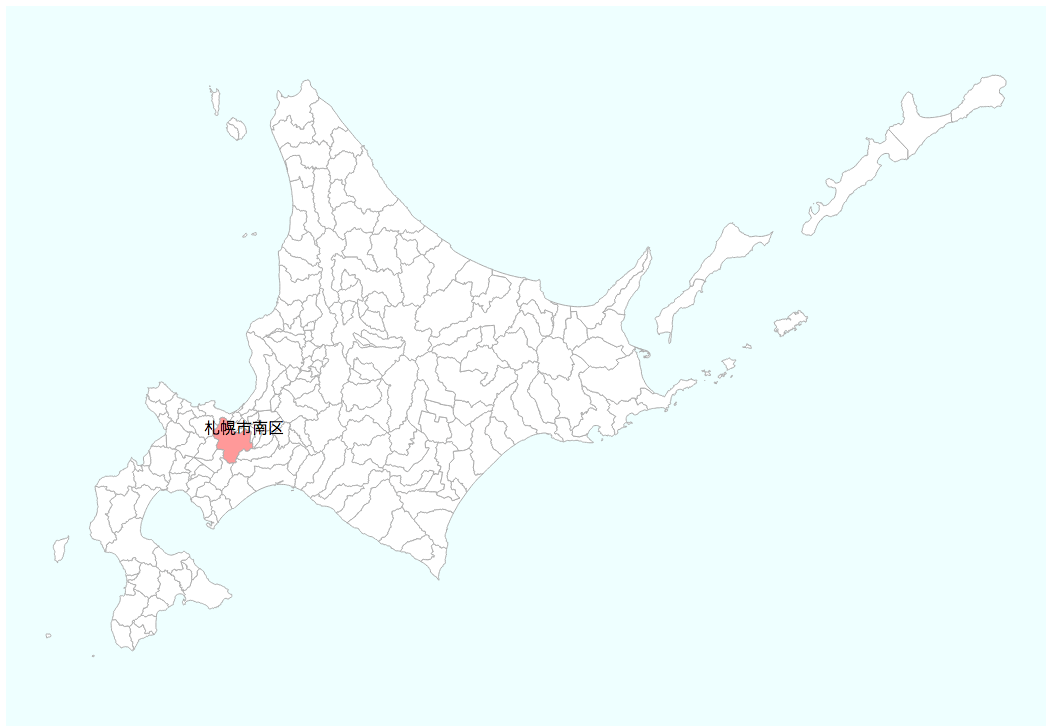
paddingがjsで取れなくて2回書いてるのがイマイチですが…。