※この記事で使っているUnityのバージョンは Unity5.2.1p3 です。
UnityEditor上で数学グラフをプロットさせようと思った背景
数学グラフを描画させるためだけに専用のソフトを起動するのめんどくさい
→ Unity上でグラフがプロットできれば便利なのでは
→ プロットさせてみよう
ということでUnityのインスペクター上に数学グラフを描画させてみました.
1. 準備
以下のページでyoyoさんがアップしているDrawing.csをコピペしてきてProjectの中に入れます. (ノートの写真付きのレスがそれです)
http://forum.unity3d.com/threads/drawing-lines-in-the-editor.71979/
2. Inspectorにグラフを描画するGraphDrawer
以下のスクリプトを作成してEditorフォルダに入れます.
グリッドの描画は Unity の Editor 拡張でインスペクタにグラフを描画する方法を色々調べてみたからお借りしました.
GraphDrawer.cs
using UnityEngine;
using UnityEditor;
using System.Collections;

// グラフ描画
public class GraphDrawer
{
    public const int Grid = 10 + 1;

    private const float AreaHeight = 175f;

    private const float SoundLineScale = 1f;

    private const float SpectrumBarScale = 3f;
    private const float BarWidth = 0.5f;

    private static readonly Vector2 labelSize = new Vector2(100f, 50f);
    private static GUIStyle ylabelStyle = null;

    public enum Mode
    {
        LineChart, // 折れ線グラフ
        BarChart, // 棒グラフ
    }

    public static void DrawGraph(
      double[] buffer,
      int drawLength,
      Color color,
      Mode mode,
      string[] xLabel = null,
      string[] yLabel = null
      )
    {
        GUILayout.Space(8f);

        const float labelOffsetX = -105f;
        Rect area = GUILayoutUtility.GetRect(Screen.width / 2, AreaHeight);
        area.x += 38f;
        area.xMax -= 70f;

        // Grid
        int xdiv = Grid - 1;
        int ydiv = Grid - 1;

        if (xLabel != null) { xdiv = xLabel.Length - 1; }
        if (yLabel != null) { ydiv = yLabel.Length - 1; }

        for (int xi = 0; xi <= xdiv; ++xi)
        {
            var lineColor = (xi == 0 || xi == xdiv) ? Color.white : Color.gray;
            var lineWidth = (xi == 0 || xi == xdiv) ? 2f : 1f;
            var x = (area.width / xdiv) * xi;

            Drawing.DrawLine(
                new Vector2(area.x + x, area.y),
                new Vector2(area.x + x, area.yMax), lineColor, lineWidth, true);

            if (xLabel != null)
            {
                // x軸のラベル表示
                Vector2 vx = new Vector2(area.x + x - 4f, area.yMax + 1f);
                GUI.Label(new Rect(vx, labelSize), xLabel[xi]);
            }
        }

        for (int yi = 0; yi <= ydiv; ++yi)
        {
            var lineColor = (yi == 0 || yi == ydiv) ? Color.white : Color.gray;
            var lineWidth = (yi == 0 || yi == ydiv) ? 2f : 1f;
            var y = (area.height / ydiv) * yi;

            Drawing.DrawLine(
                new Vector2(area.x, area.y + y),
                new Vector2(area.xMax, area.y + y), lineColor, lineWidth, true);

            if (yLabel != null)
            {
                if (ylabelStyle == null)
                {
                    ylabelStyle = new GUIStyle(EditorStyles.label);
                    ylabelStyle.alignment = TextAnchor.UpperRight;
                }

                // y軸のラベル表示
                Vector2 vy = new Vector2(area.x + labelOffsetX, area.y + y - 7f);
                GUI.Label(new Rect(vy, labelSize), yLabel[ydiv - yi], ylabelStyle);
            }
        }

        if (buffer == null) { return; }

        var dx = area.width / (drawLength - 1);
        var dy = area.height;
        Vector2 previousPos = new Vector2(area.x, area.yMax);

        bool outed = true;
        int bufferLength = buffer.Length;
        if (bufferLength == 0) { Debug.LogError("bufferLength is zero"); return; }
        int pos = 0;
        for (var i = 0; i < drawLength; i++)
        {
            switch (mode)
            {
                case Mode.LineChart:
                    {
                        float x = area.x + dx * i;
                        double pre = pos > 0.0 ? buffer[pos - 1] : 0.0;
                        double value = buffer[pos];
                        float y = (float)(area.yMax - dy * value);
                        var currentPos = new Vector2(x, y);
                        if (!outed)
                        {
                            Drawing.DrawLine(previousPos, currentPos, color, 1f, true);
                        }
                        previousPos = currentPos;

                        if (value < 0 || value > 1)
                        {
                            outed = true;
                        }
                        else
                        {
                            outed = false;
                        }

                    }
                    break;
                case Mode.BarChart:
                    {
                        float x = area.x + dx * i;
                        double value = buffer[pos];
                        float barWidth = BarWidth;

                        value = MyMath.Clamp01(value);

                        float y = (float)(area.yMax - dy * value);
                        var currentPos = new Vector2(x, y);
                        Drawing.DrawLine(new Vector2(currentPos.x, area.yMax), currentPos, color, barWidth, true);
                    }
                    break;
                default:
                    break;
            }

            pos++;
        }

        GUILayout.Space(16f);
    }

    public static class MyMath
    {
        // UnityEngine.Mathf.Clamp01のdouble版
        public static double Clamp01(double value)
        {
            if (value < 0.0) { return 0.0; }
            if (value > 1.0) { return 1.0; }
            return value;
        }
    }
}
3. 数学グラフを描画するGraphInspector
Editorフォルダに入れてください.
GraphInspector.cs
using UnityEngine;
using UnityEditor;

public abstract class GraphInspector : Editor
{
  // グラフの描画範囲
  const double MinX = -1.0;
  const double MaxX = 1.0;
  const double MinY = -0.1;
  const double MaxY = 1.0;

  const int DataNum = 512;
  const int XLabelNum = 9;
  const int YLabelNum = 5;

  private double[] buffer = null;
  private string[] xLabel = new string[XLabelNum];
  private string[] yLabel = new string[YLabelNum];

  // Inspector拡張
  public override void OnInspectorGUI()
  {
    base.OnInspectorGUI();
    this.Draw();
  }

  // Inspectorが画面に表示されたときに呼ばれる
  private void OnEnable()
  {
    this.Plot();
  }

  // グラフをプロット
  protected void Plot()
  {
    this.buffer = new double[DataNum];

    for (int i = 0; i < DataNum; i++)
    {
      double x = MinX + (MaxX - MinX) * i / (DataNum - 1);
      double y = this.Eval(x);
      // 変換
      y -= MinY;
      y /= (MaxY - MinY);

      buffer[i] = y;
    }

    this.xLabel = new string[XLabelNum];
    this.yLabel = new string[YLabelNum];

    for (int i = 0; i < XLabelNum; i++)
    {
      double x = MinX + (MaxX - MinX) * i / (XLabelNum - 1);
      xLabel[i] = x.ToString();
    }

    for (int i = 0; i < YLabelNum; i++)
    {
      double y = MinY + (MaxY - MinY) * i / (YLabelNum - 1);
      yLabel[i] = y.ToString();
    }
  }

  // Inspectorへグラフを描画
  private void Draw()
  {
    if (this.buffer == null) { this.Plot(); }

    GraphDrawer.DrawGraph(
        buffer,
        buffer.Length,
        Color.red,
        GraphDrawer.Mode.LineChart,
        this.xLabel,
        this.yLabel);
  }

  protected abstract double Eval(double x);
}
4. 数学グラフを描画させてみる
以下のスクリプトを作成して適当なGameObjectにアタッチ
GraphTest.cs
using UnityEngine;
using System.Collections;

public class GraphTest : MonoBehaviour
{
  public double Eval(double x)
  {
    return x * x;
  }
}
Editorスクリプトも作成 (Editorフォルダ内へ入れてください)
GraphInspectorTest.cs
using UnityEngine;
using UnityEditor;
using System.Collections;

[CustomEditor(typeof(GraphTest))]
public class GraphInspectorTest : GraphInspector
{
  public override void OnInspectorGUI()
  {
    base.OnInspectorGUI();
  }

  protected override double Eval(double x)
  {
    GraphTest graph = target as GraphTest;
    return graph.Eval(x);
  }
}
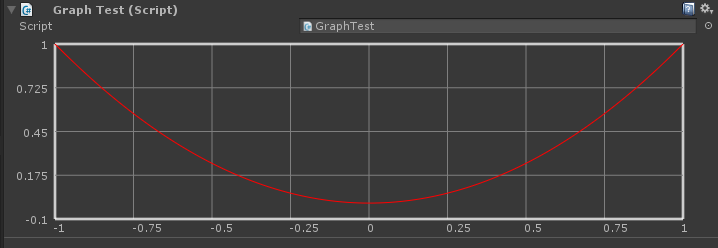
結果
以下は y = x^2 をプロットしたものです

GraphInspector.cs のMinXなどをいじれば描画範囲を変えたりできます.
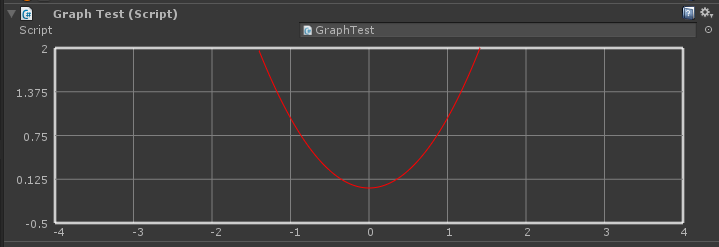
GraphInspector.cs
  // グラフの描画範囲
  const double MinX = -4.0;
  const double MaxX = 4.0;
  const double MinY = -0.5;
  const double MaxY = 2.0;
GraphTest.cs のEvalの中身を弄れば好きな数学関数をプロットできます.
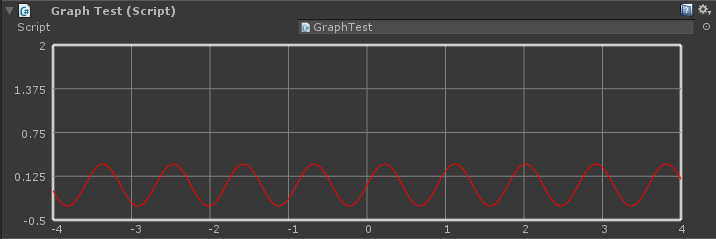
GrasphTest.cs
  public double Eval(double x)
  {
    return System.Math.Sin(x * 7.0) * 0.3;
  }
つくってみた感想
インスペクターではなくEditorWindowにプロットさせたほうが使いやすいかもしれない(UnityEditor.Graphsが使えるので)
参考
Unity の Editor 拡張でインスペクタにグラフを描画する方法を色々調べてみた
http://tips.hecomi.com/entry/2014/06/23/222805