以下のようなタブ区切りの数値データ系列ファイルからデータを読み込み重回帰線を求めるプログラム。
1行目:目的変数(y)
2行目:説明変数1(x1)
3行目:説明変数2(x2)
MultipleRegressionAnalysis_Data1.txt
65.7	67.8	70.3	72.0	74.3	76.2
3.27	3.06	4.22	4.10	5.26	6.18
69.7	69.7	71.3	77.6	81.0	78.7
MultipleRegressionAnalysis_2.py
from matplotlib import pyplot as plt
import numpy as np
from mpl_toolkits.mplot3d import Axes3D
def load_data(filename):
with open(filename) as lines:
return [[float(data) for data in line.strip().split('\t')]
for line in lines]
def calc_average(data):
return sum(data) / len(data)
def calc_sum_of_square(data_list):
ave = calc_average(data_list)
return sum((d - ave)**2 for data in data_list)
def calc_sum_of_square(data_list1, data_list2):
ave1 = calc_average(data_list1)
ave2 = calc_average(data_list2)
return sum((data1 * data2 - ave1 * ave2)**2 for data1, data2 in zip(data_list1, data_list2))
if __name__ == "__main__":
data = load_data('MultipleRegressionAnalysis_Data1.txt')
s = [[calc_sum_of_square(data1, data2) for data2 in data]
for data1 in data]
det = s[1][1]*s[2][2] - s[1][2]**2
# 偏回帰係数計算
b1 = (s[0][1]*s[2][2] - s[0][2]*s[1][2])/det
b2 = (s[0][2]*s[1][1] - s[0][1]*s[1][2])/det
b0 = calc_average(data[0]) - b1*calc_average(data[1]) - b2*calc_average(data[2])
# 重回帰式表示
print("Y = " + str(b1) + " x1 + " + str(b2) + " x2 + " + str(b0))
fig = plt.figure()
ax = Axes3D(fig)
# 求めた重回帰式から平面表示
x1 = np.arange(0, 10, 0.25)
x2 = np.arange(65, 80, 0.25)
X1, X2 = np.meshgrid(x1, x2)
Y = b1 * X1 + b2 * X2 + b0
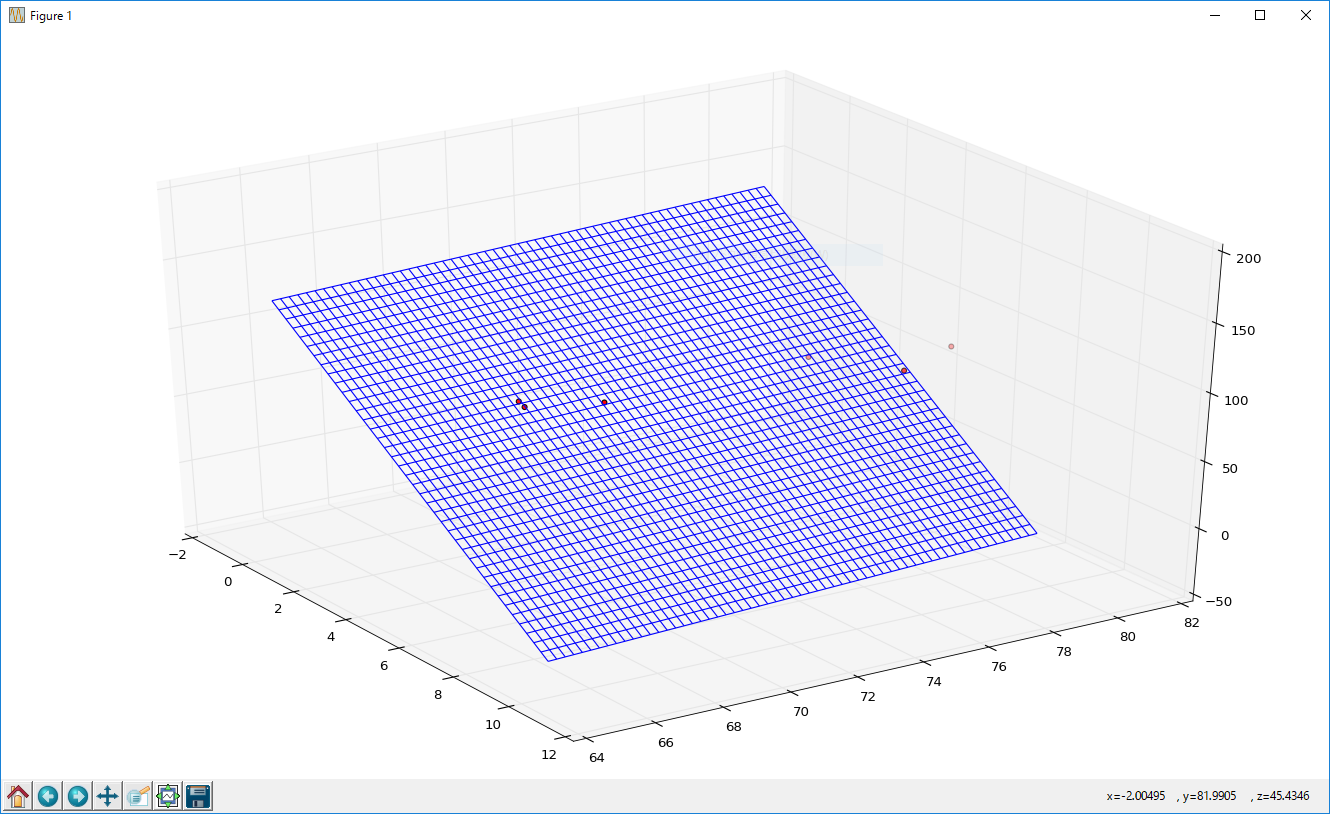
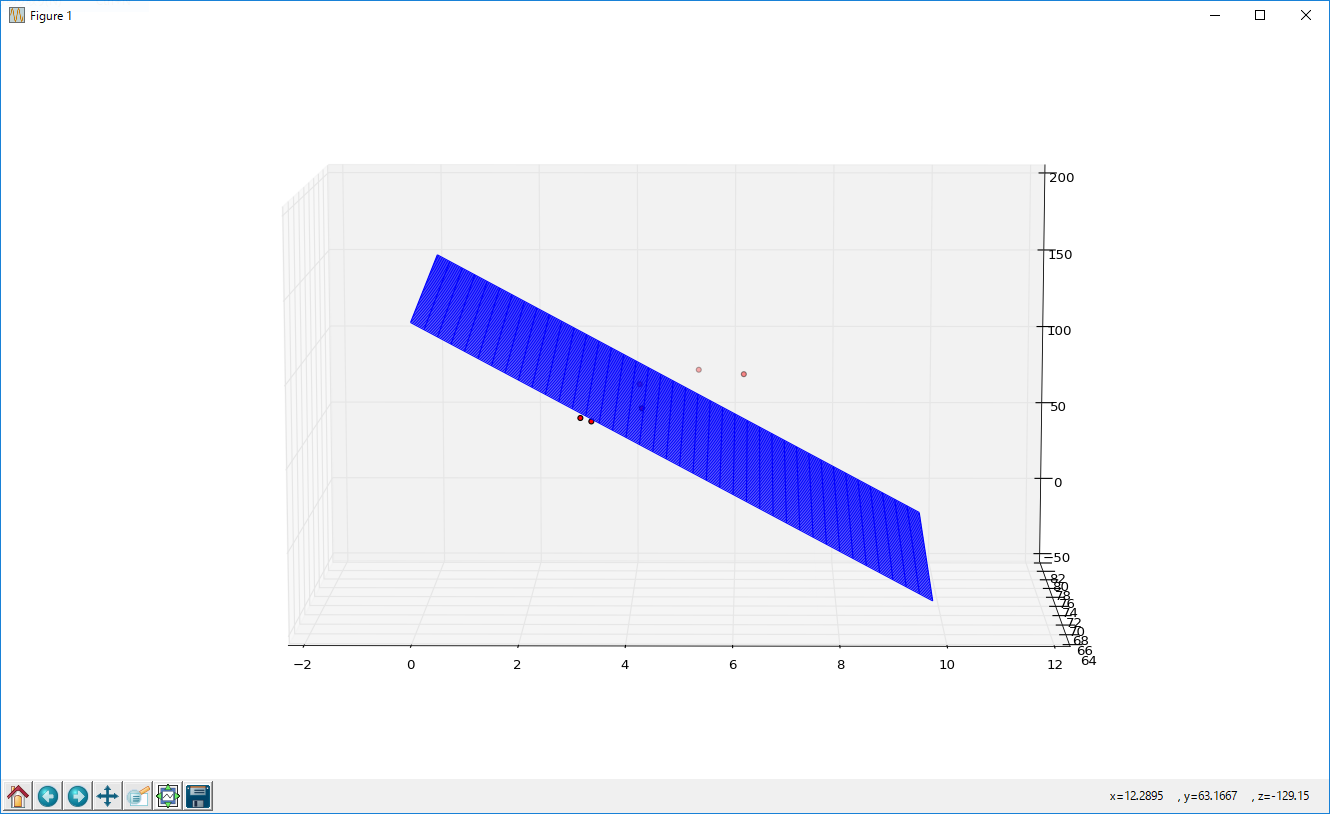
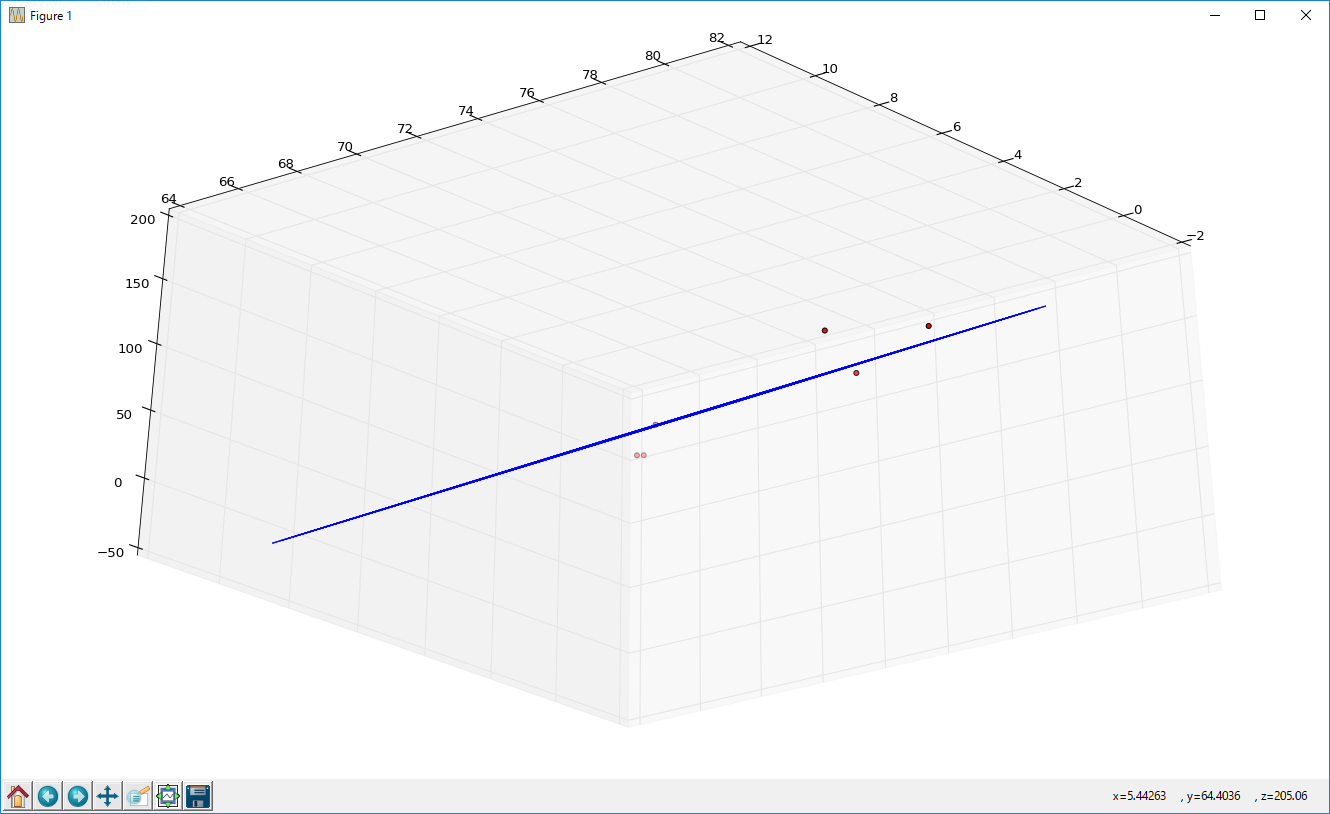
ax.plot_wireframe(X1, X2, Y)
# 元データ表示
ax.scatter3D(data[1], data[2], data[0], c='red')
plt.show()
結果
> python MultipleRegressionAnalysis_2.py
Y = -17.118276566578807 x1 + 1.0700625679745137 x2 + 65.58796752824318