概要
活性化関数をグラフ化してみた。
写真
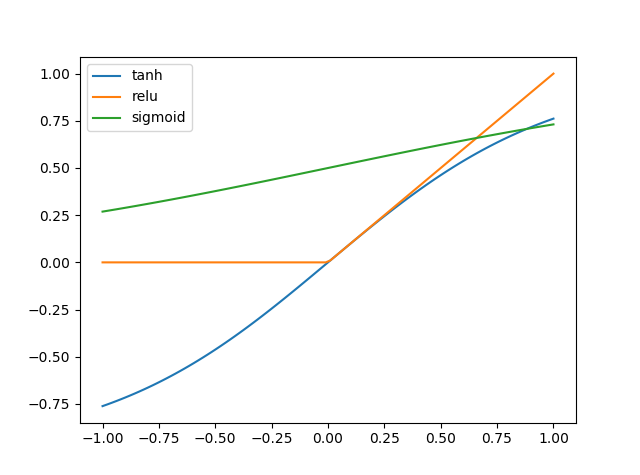
サンプルコード
import matplotlib.pyplot as plt
import numpy as np

def tanh(x):
    return np.tanh(x);
def relu(x):
    return np.maximum(0, x)
def sigmoid(x):
    return 1.0 / (1.0 + np.exp(-x))
x = np.linspace(-1.0, 1.0, 100)
plt.plot(x, tanh(x), label = "tanh")
plt.plot(x, relu(x), label = "relu")
plt.plot(x, sigmoid(x), label = "sigmoid")
plt.legend()
plt.show()