#環境
- ホストOS : Mac OSX Yosemite
- ゲストOS : Ubuntu 14.04.1 LTS
#手順
XQuartzをインストール
Macにこれをインストール
http://xquartz.macosforge.org/landing/
Vagrantfile編集
Vagrantfile
Vagrant.configure(VAGRANTFILE_API_VERSION) do |config|
  config.ssh.forward_x11 = true    # これを追加
end
UbuntuにX11, Matplotlib, NumPy, SciPy, IPythonをインストール
$ vagrant up
$ vagrant ssh
vagrant@vagrant-ubuntu-trusty-64:~$ sudo apt-get update
vagrant@vagrant-ubuntu-trusty-64:~$ sudo apt-get install -y xorg python-matplotlib python-numpy python-scipy ipython
Ubuntuを再起動してグラフ表示
$ vagrant reload
$ vagrant ssh
vagrant@vagrant-ubuntu-trusty-64:~$ ipython --pylab
In [1]: import matplotlib.pyplot as plot
In [2]: import scipy as sp
In [3]: x = sp.arange(1,100)
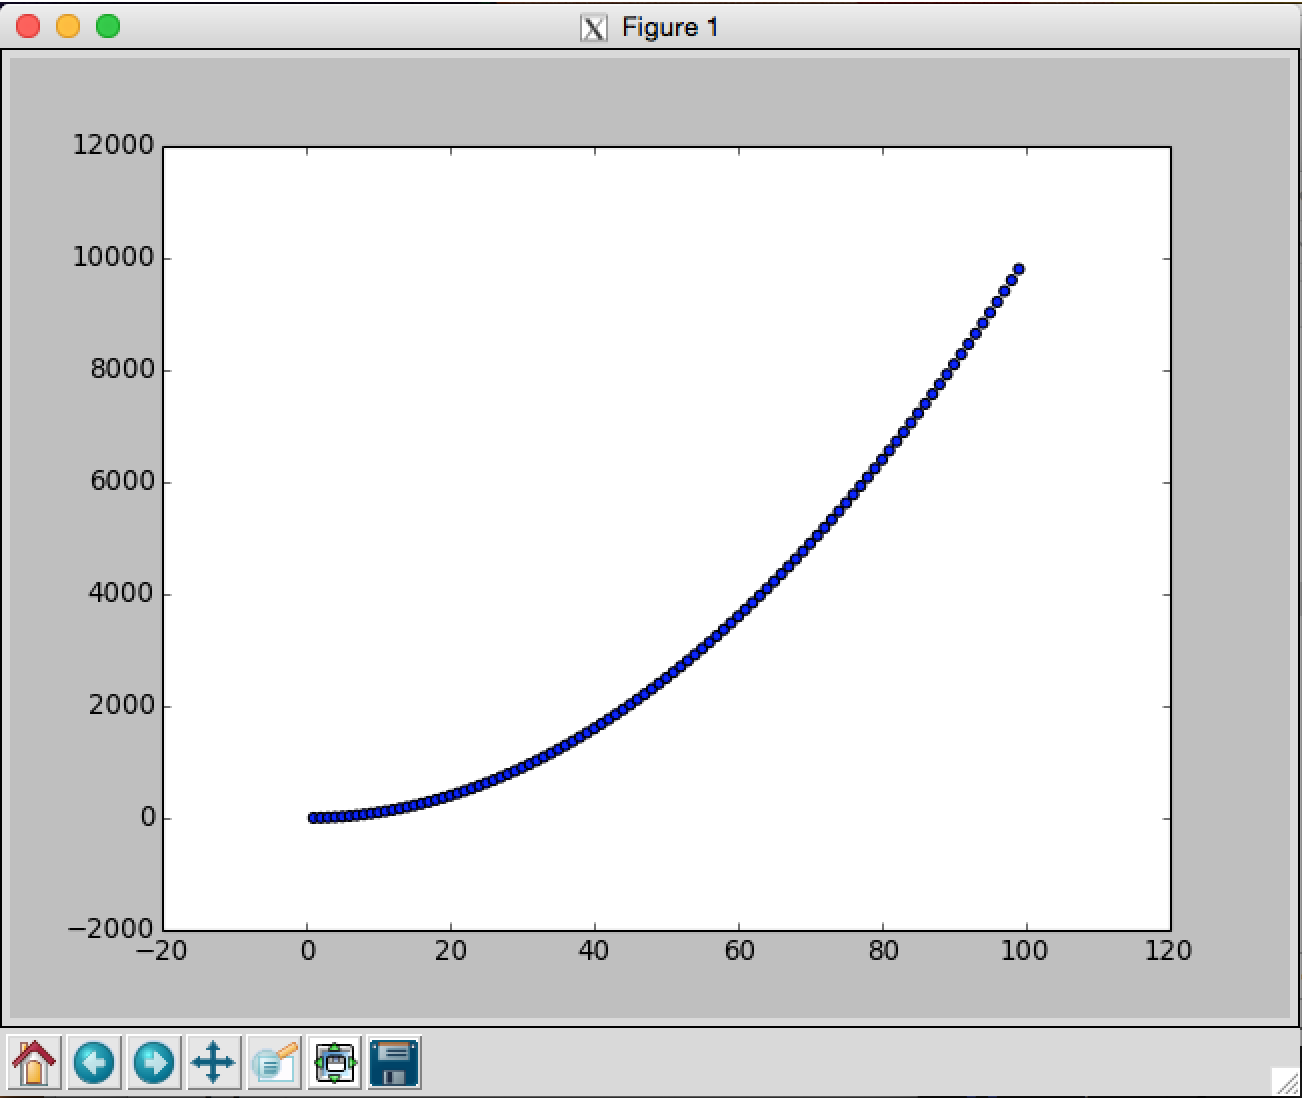
In [4]: plot.scatter(x, x**2)
X11 Forwardingがうまくいかないとき
vagrant sshしたときに
/home/vagrant/.Xauthority not writable, changes will be ignored
と出たら、~/.Xauthority*を削除してログインし直してみてください。
