先週末にPostgreSQL 9.6.0がリリースされたというのに、ろくに触っていない・・・
ということで、やっとで触ってみることにしました。
パラレルスキャンとパーティショニング
PostgreSQL 9.6の目玉機能の一つ、パラレススキャン。
それほど面倒な設定をしなくても(max_parallel_workers_per_gatherを0以外に設定するだけでいい)、ある程度の大きさのテーブルならよしなにパラレルにスキャンしてくれる機能。
CPUが多い環境なら、フルスキャンや集約関数を使うクエリで効果を発揮してくれるようなのですが、PostgreSQLの既存機能との組み合わせはどうなんだろう、ということでパーティショニングと組み合わせみることにした。
モデル
0から9までの数値をパーティションキーとした、10個の子テーブルを持つパーティーションテーブルで試している。
また、比較のために同じレコード数の単一テーブルでも試してみた。
検証用のテーブルの作成スクリプトはこんな感じ
パーティションなしのテーブル
CREATE UNLOGGED TABLE test (
  part_key int,
  data1 int,
  data2 text
);
これに、こんな感じで総計400万件のデータを突っ込む。
INSERT INTO test VALUES (0, generate_series(0, 399999), md5(clock_timestamp()::text));
INSERT INTO test VALUES (1, generate_series(0, 399999), md5(clock_timestamp()::text));
INSERT INTO test VALUES (2, generate_series(0, 399999), md5(clock_timestamp()::text));
INSERT INTO test VALUES (3, generate_series(0, 399999), md5(clock_timestamp()::text));
INSERT INTO test VALUES (4, generate_series(0, 399999), md5(clock_timestamp()::text));
INSERT INTO test VALUES (5, generate_series(0, 399999), md5(clock_timestamp()::text));
INSERT INTO test VALUES (6, generate_series(0, 399999), md5(clock_timestamp()::text));
INSERT INTO test VALUES (7, generate_series(0, 399999), md5(clock_timestamp()::text));
INSERT INTO test VALUES (8, generate_series(0, 399999), md5(clock_timestamp()::text));
INSERT INTO test VALUES (9, generate_series(0, 399999), md5(clock_timestamp()::text));
パーティション化したテーブル
CREATE UNLOGGED TABLE test (
  part_key int,
  data1 int,
  data2 text
);

CREATE UNLOGGED TABLE test_00 (CHECK ((part_key ) = 0)) INHERITS (test);
CREATE UNLOGGED TABLE test_01 (CHECK ((part_key ) = 1)) INHERITS (test);
CREATE UNLOGGED TABLE test_02 (CHECK ((part_key ) = 2)) INHERITS (test);
CREATE UNLOGGED TABLE test_03 (CHECK ((part_key ) = 3)) INHERITS (test);
CREATE UNLOGGED TABLE test_04 (CHECK ((part_key ) = 4)) INHERITS (test);
CREATE UNLOGGED TABLE test_05 (CHECK ((part_key ) = 5)) INHERITS (test);
CREATE UNLOGGED TABLE test_06 (CHECK ((part_key ) = 6)) INHERITS (test);
CREATE UNLOGGED TABLE test_07 (CHECK ((part_key ) = 7)) INHERITS (test);
CREATE UNLOGGED TABLE test_08 (CHECK ((part_key ) = 8)) INHERITS (test);
CREATE UNLOGGED TABLE test_09 (CHECK ((part_key ) = 9)) INHERITS (test);
同様に400万件のデータを突っ込む。今回は親テーブルからトリガ経由ではINSERTせず、直接子テーブルにINSERTする。
INSERT INTO test_00 VALUES (0, generate_series(0, 399999), md5(clock_timestamp()::text));
INSERT INTO test_01 VALUES (1, generate_series(0, 399999), md5(clock_timestamp()::text));
INSERT INTO test_02 VALUES (2, generate_series(0, 399999), md5(clock_timestamp()::text));
INSERT INTO test_03 VALUES (3, generate_series(0, 399999), md5(clock_timestamp()::text));
INSERT INTO test_04 VALUES (4, generate_series(0, 399999), md5(clock_timestamp()::text));
INSERT INTO test_05 VALUES (5, generate_series(0, 399999), md5(clock_timestamp()::text));
INSERT INTO test_06 VALUES (6, generate_series(0, 399999), md5(clock_timestamp()::text));
INSERT INTO test_07 VALUES (7, generate_series(0, 399999), md5(clock_timestamp()::text));
INSERT INTO test_08 VALUES (8, generate_series(0, 399999), md5(clock_timestamp()::text));
INSERT INTO test_09 VALUES (9, generate_series(0, 399999), md5(clock_timestamp()::text));
測定環境
いつものように、手元のLet's note SX4(SSD)上のVMWare/CentOS7上で測定してみる。
CPU数は2。なので、もともとパラレルクエリ向きの環境ではないのだが・・・
測定パターン
測定パターンは以下の組み合わせ
| パーティション化 | max_parallel_workers_per_gather | クエリ |
|---|---|---|
| なし | 0 | SELECT COUNT(data1) FROM test |
| なし | 0 | SELECT COUNT(*) FROM test WHERE part_key = 2 |
| なし | 8 | SELECT COUNT(data1) FROM test |
| なし | 8 | SELECT COUNT(*) FROM test WHERE part_key = 2 |
| あり | 0 | SELECT COUNT(data1) FROM test |
| あり | 0 | SELECT COUNT(*) FROM test WHERE part_key = 2 |
| あり | 8 | SELECT COUNT(data1) FROM test |
| あり | 8 | SELECT COUNT(*) FROM test WHERE part_key = 2 |
このクエリを EXPLAIN ANALYZE VERBOSE で実行する。
測定結果
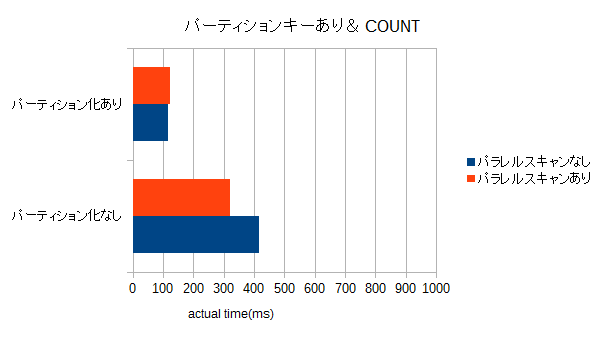
パーティションキーあり
| パーティション化 | max_parallel_workers_per_gather | actual time(ms) |
|---|---|---|
| なし | 0 | 415.24 |
| なし | 8 | 322.346 |
| あり | 0 | 117.825 |
| あり | 8 | 123.193 |
パーティションなし/パラレルスキャンなしの実行計画
 Aggregate  (cost=93516.07..93516.08 rows=1 width=8) (actual time=415.246..415.246 rows=1 loops=1)
   Output: count(*)
   ->  Seq Scan on public.test  (cost=0.00..93460.00 rows=22430 width=0) (actual time=84.470..384.350 rows=400000 loops=1)
         Output: part_key, data1, data2
         Filter: (test.part_key = 2)
         Rows Removed by Filter: 3600000
 Planning time: 0.145 ms
 Execution time: 415.268 ms
パーティションなし/パラレルスキャンありの実行計画
 Finalize Aggregate  (cost=52417.44..52417.45 rows=1 width=8) (actual time=322.346..322.346 rows=1 loops=1)
   Output: count(*)
   ->  Gather  (cost=52417.02..52417.43 rows=4 width=8) (actual time=314.456..322.339 rows=5 loops=1)
         Output: (PARTIAL count(*))
         Workers Planned: 4
         Workers Launched: 4
         ->  Partial Aggregate  (cost=51417.02..51417.03 rows=1 width=8) (actual time=295.995..295.995 rows=1 loops=5)
               Output: PARTIAL count(*)
               Worker 0: actual time=306.582..306.583 rows=1 loops=1
               Worker 1: actual time=272.930..272.930 rows=1 loops=1
               Worker 2: actual time=290.525..290.525 rows=1 loops=1
               Worker 3: actual time=295.753..295.754 rows=1 loops=1
               ->  Parallel Seq Scan on public.test  (cost=0.00..51403.00 rows=5608 width=0) (actual time=73.011..279.915 rows=80000 loops=5)
                     Filter: (test.part_key = 2)
                     Rows Removed by Filter: 720000
                     Worker 0: actual time=76.221..295.709 rows=129042 loops=1
                     Worker 1: actual time=67.802..269.187 rows=38306 loops=1
                     Worker 2: actual time=75.836..236.439 rows=78859 loops=1
                     Worker 3: actual time=64.681..290.886 rows=52109 loops=1
 Planning time: 0.042 ms
 Execution time: 322.418 ms
パーティションあり/パラレルスキャンなしの実行計画
 Aggregate  (cost=9353.11..9353.12 rows=1 width=8) (actual time=117.825..117.825 rows=1 loops=1)
   Output: count(*)
   ->  Append  (cost=0.00..9347.50 rows=2244 width=0) (actual time=0.011..91.407 rows=400000 loops=1)
         ->  Seq Scan on public.test  (cost=0.00..0.00 rows=1 width=0) (actual time=0.002..0.002 rows=0 loops=1)
               Filter: (test.part_key = 2)
         ->  Seq Scan on public.test_02  (cost=0.00..9347.50 rows=2243 width=0) (actual time=0.009..64.883 rows=400000 loops=1)
               Filter: (test_02.part_key = 2)
 Planning time: 0.292 ms
 Execution time: 117.844 ms
パーティションあり/パラレルスキャンありの実行計画
 Finalize Aggregate  (cost=7078.43..7078.44 rows=1 width=8) (actual time=123.193..123.193 rows=1 loops=1)
   Output: count(*)
   ->  Gather  (cost=7078.22..7078.43 rows=2 width=8) (actual time=117.858..123.187 rows=3 loops=1)
         Output: (PARTIAL count(*))
         Workers Planned: 2
         Workers Launched: 2
         ->  Partial Aggregate  (cost=6078.22..6078.23 rows=1 width=8) (actual time=90.087..90.087 rows=1 loops=3)
               Output: PARTIAL count(*)
               Worker 0: actual time=38.583..38.583 rows=1 loops=1
               Worker 1: actual time=113.979..113.979 rows=1 loops=1
               ->  Append  (cost=0.00..6075.88 rows=936 width=0) (actual time=0.022..65.811 rows=133333 loops=3)
                     Worker 0: actual time=0.038..12.973 rows=39590 loops=1
                     Worker 1: actual time=0.018..92.142 rows=284547 loops=1
                     ->  Parallel Seq Scan on public.test  (cost=0.00..0.00 rows=1 width=0) (actual time=0.000..0.000 rows=0 loops=3)
                           Filter: (test.part_key = 2)
                           Worker 0: actual time=0.000..0.000 rows=0 loops=1
                           Worker 1: actual time=0.000..0.000 rows=0 loops=1
                     ->  Parallel Seq Scan on public.test_02  (cost=0.00..6075.88 rows=935 width=0) (actual time=0.021..55.528 rows=133333 loops=3)
                           Filter: (test_02.part_key = 2)
                           Worker 0: actual time=0.036..9.671 rows=39590 loops=1
                           Worker 1: actual time=0.017..70.662 rows=284547 loops=1
 Planning time: 0.149 ms
 Execution time: 123.437 ms
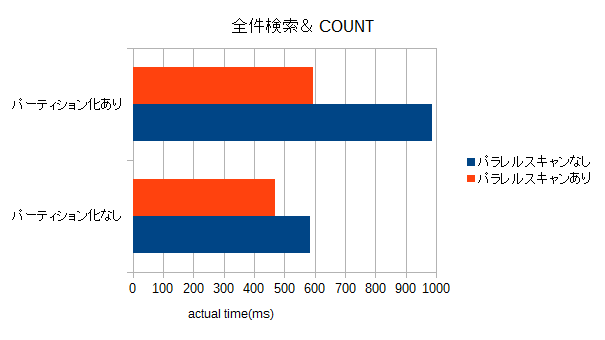
パーティションキーなし(全件検索)
| パーティション化 | max_parallel_workers_per_gather | actual time(ms) |
|---|---|---|
| なし | 0 | 583.101 |
| なし | 8 | 460.353 |
| あり | 0 | 987.455 |
| あり | 8 | 594.362 |
※こっちの実行計画は割愛
考察(というほどのものではないが)
-
パーティション化していないテーブルの場合、パラレルスキャンにすることで、すこーしだけ検索性能は向上する。
-
パーティション化したテーブルでかつ、フルスキャン(一番効率がよろしくない)の場合には、相対的にパラレルスキャンの効果が見えてくる。
-
パーティションプルーニングが効く場合には、この環境だとあまり効果は見えない。CPU数が増えればもうちょっと効果が見えてくるのかな。
-
実行計画を見て(当たり前だが)気づいたこと。今回は10パーティションで等分にデータを投入したので、1パーティションのデータ量は、1/10になる。
- つまり、パラレルクエリ有効時に起動するワーカ数は非パーティションの場合、パーティションテーブルと比較すると2つ多くなる。
- CPU数が多い/パーティション数が多い場合には、パーティション化するよりも物理で殴るスタイルのほうが良かったりするケースもある?
-
パーティション化した場合かつパラレルクエリが有効な場合、子テーブルの処理は別にパラレルに行われるわけでなく、子テーブルに対する検索はシーケンシャルに実行されているっぽい。
うーむ。AWSでほどほどにCPU数の多いインスタンスを使って、同じモデルで検証したほうがいいのかなー。