あまり上手くできていない。
使用するデータ
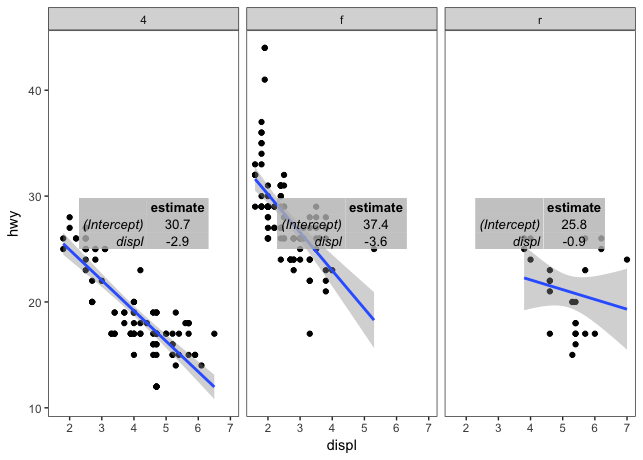
mpgをdisplとhwyの関係をdrv毎にプロットする。
p <- ggplot(mpg, aes(displ, hwy)) +
  geom_point() +
  facet_wrap(~drv) +
  theme_bw() +
  theme(panel.grid = element_blank()) +
  geom_smooth(method = "lm")
tableGrobを作成する
drvで分割して回帰して切片と傾きを取り出してデータフレームにしてtableGrobを作成する。
tpar = list(bg_params = list(fill = "gray", alpha = 0.8)) # 表の外観パラメータ
tg <- mpg %>%
  split(.$drv) %>%
  purrr::map(., ~ (lm(hwy ~ displ, data = .) %>% broom::tidy())[1:2]) %>%
  purrr::map(., ~ data.frame(coef =  round(.[2], 1),
                             row.names = c("(Intercept)", "displ"))) %>%
  purrr::map(., tableGrob,
             theme = ttheme_minimal(
               base_size = 10,
               padding = unit(c(2, 2), "mm"),
               core = tpar,
               colhead = tpar,
               rowhead = tpar
             ))
プロットする
## gtableの作成
g <- ggplot_gtable(ggplot_build(p))

## facetsの取得
facets <- grep("panel", g$layout$name)

## tableGrobを書き込む
g2 <- with(g$layout[facets, ],
           gtable_add_grob(g, tg,
                           t=t, l=l))
plot(g2)
位置の調整ができない…。