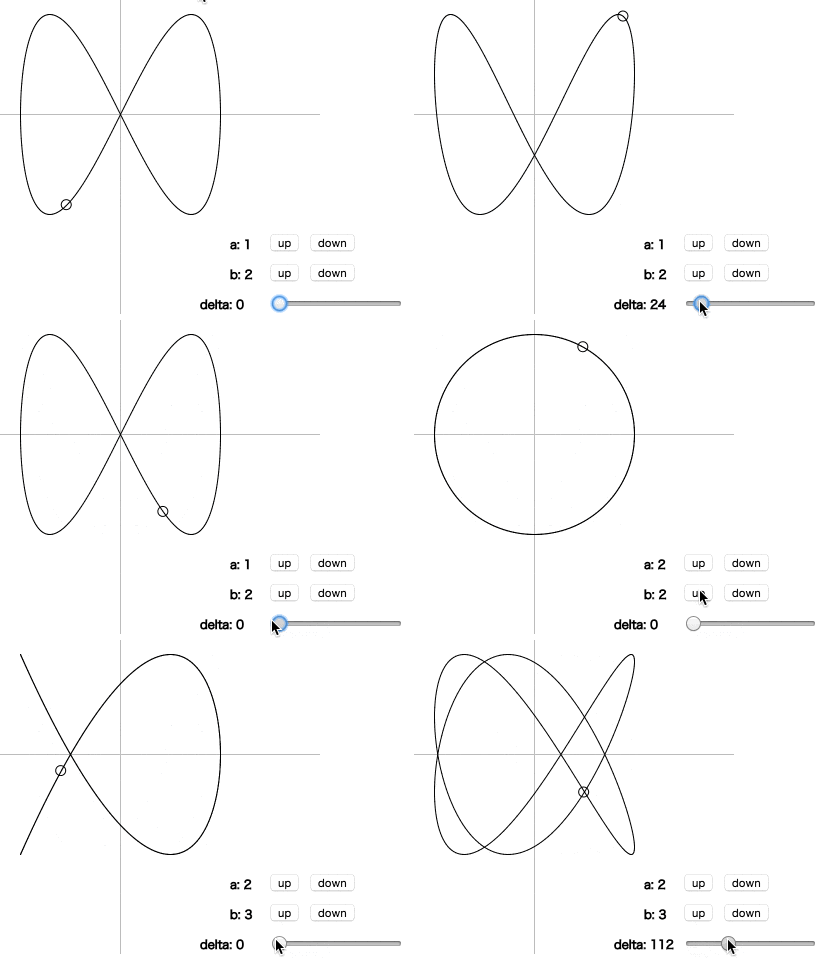
数学ガールの秘密ノートの第23回、第24回でリサージュ図形が出てきます。
リサージュ図形を p5.js で作成してみました。
x = r * cos(a * t)
y = r * sin(b * t + delta)
上記の式の a, b, delta を変更すると、いろんな形のリサージュ図形が現れます。
- up, down ボタンで
a,bの値を変更します。 - スライダーを動かすと、
deltaの値を変更します。
プログラム
lissajous-curve.js
'use strict';

// x = r * cos(a * t)
// y = r * sin(b * t + delta)

var a = 1; // パラメータ a
var b = 1; // パラメータ b
var buttonIncA, buttonDecA; // パラメータ a を変更するボタン
var buttonIncB, buttonDecB; // パラメータ b を変更するボタン
var slider; // パラメータ delta を変更するスライダー

function setup() {
    createCanvas(400, 400);
    noFill();

    buttonIncA = createButton("up");
    buttonIncA.position(width - 50, height - 80);
    buttonIncA.mousePressed(function() { a++; });

    buttonDecA = createButton("down");
    buttonDecA.position(width - 10, height - 80);
    buttonDecA.mousePressed(function() { a = Math.max(1, a-1); });

    buttonIncB = createButton("up");
    buttonIncB.position(width - 50, height - 50);
    buttonIncB.mousePressed(function() { b++; });

    buttonDecB = createButton("down");
    buttonDecB.position(width - 10, height - 50);
    buttonDecB.mousePressed(function() { b = Math.max(1, b-1); });

    slider = createSlider(0, 360);
    slider.position(width - 50, height - 20);
}

function draw() {
    background(255);
    translate(width/2, height/2);

    // XY 軸
    stroke(188, 188, 188);
    line(-width, 0, width, 0);
    line(0, -height, 0, height);

    // 曲線上を移動する円
    var delta = slider.value();
    var t = frameCount * 0.03;
    var r = 100;
    stroke(0);
    ellipse( r * cos(a * t),
            -r * sin(b * t + radians(delta)),
            10,
            10);

    // 曲線
    for (var i = 0; i < 360; i++) {
        var x1 = r * cos(a * radians(i));
        var y1 = r * sin(b * radians(i) + radians(delta));

        var x2 = r * cos(a * radians(i+1));
        var y2 = r * sin(b * radians(i+1) + radians(delta));
        line(x1, -y1, x2, -y2);
    }

    text("a: " + a, width/2 - 90, height/2 - 65);
    text("b: " + b, width/2 - 90, height/2 - 35);
    text("delta: " + delta, width/2 - 120, height/2 - 5);
}
HTML
<html>
<head>
  <meta charset="UTF-8">
  <script language="javascript" type="text/javascript" src="p5-release/p5.js"></script>
  <script language="javascript" src="p5-release/addons/p5.dom.js"></script>
  <script language="javascript" type="text/javascript" src="lissajous-curve.js"></script>
  <style> body {padding: 0; margin: 0;} </style>
</head>
<body>
</body>
</html>
