最近シーケンス図を書くのにPlantUMLを使っていますが、テキストベースで書けることにより無駄なレイアウト調整の作業から開放されてとても快適です。
ER図も同様に書きたいと探していたらGithubで公開されているツール(BurntSushi/erd)がありましたのでご紹介します。
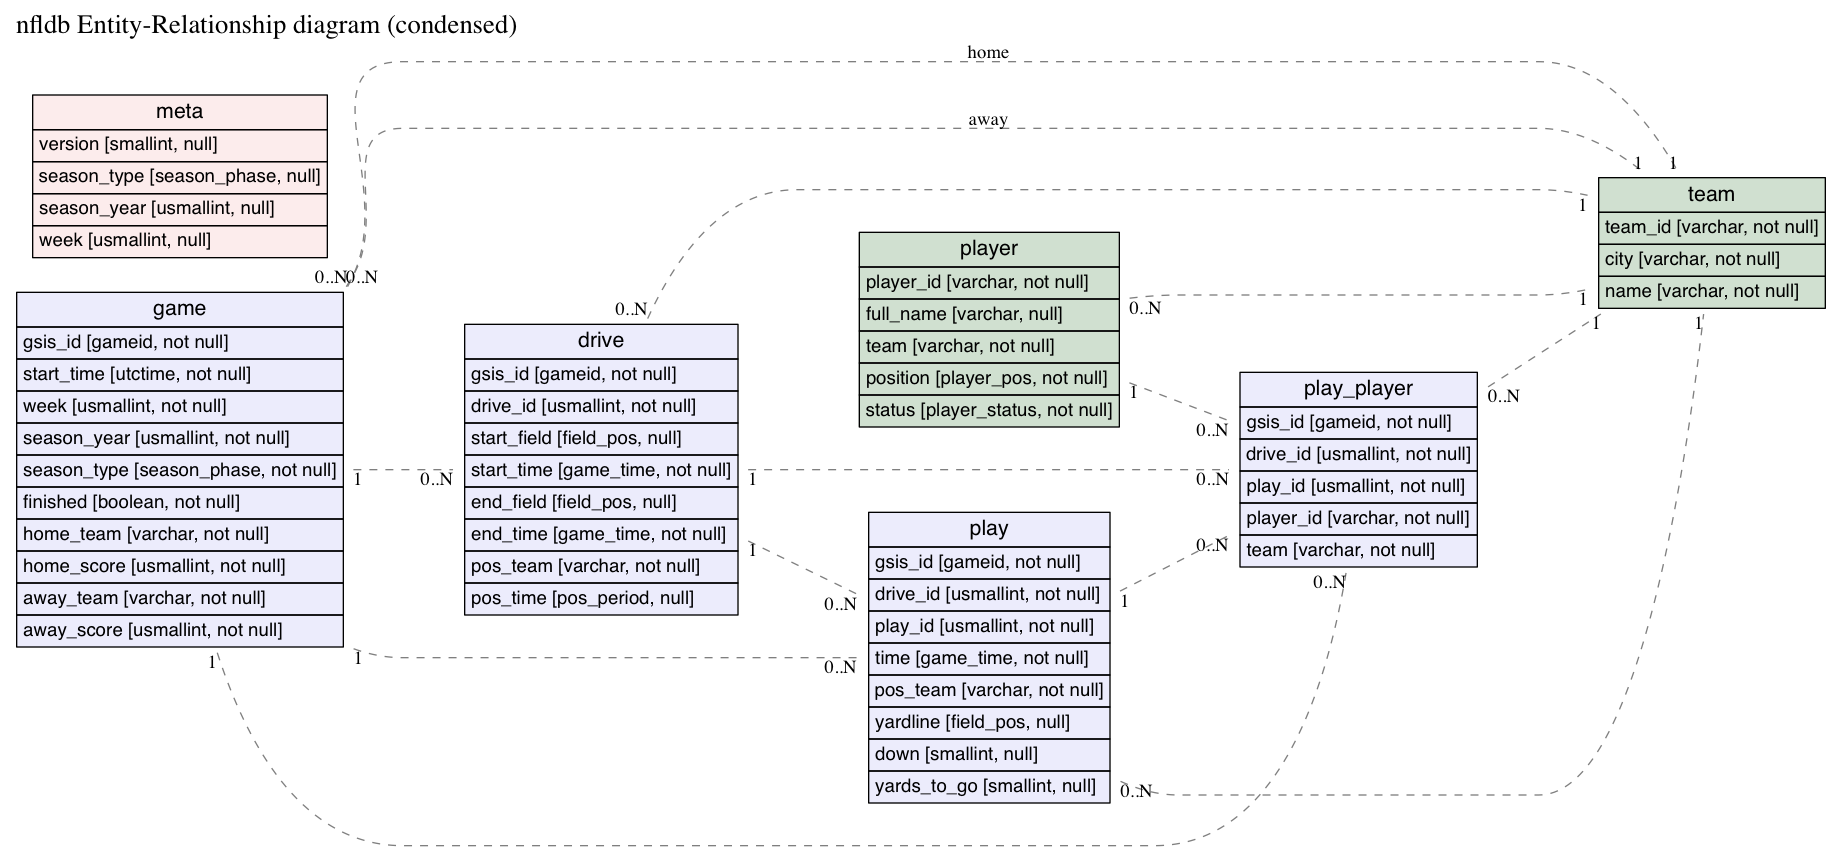
最終的に、このようなテキストを書くと、
examples/nfldb.er
title {label: "nfldb Entity-Relationship diagram (condensed)", size: "20"}

# Nice colors from Erwiz:
# red #fcecec
# blue #ececfc
# green #d0e0d0
# yellow #fbfbdb
# orange #eee0a0

# Entities

[player] {bgcolor: "#d0e0d0"}
  *player_id {label: "varchar, not null"}
  full_name {label: "varchar, null"}
  team {label: "varchar, not null"}
  position {label: "player_pos, not null"}
  status {label: "player_status, not null"}

[team] {bgcolor: "#d0e0d0"}
  *team_id {label: "varchar, not null"}
  city {label: "varchar, not null"}
  name {label: "varchar, not null"}

[game] {bgcolor: "#ececfc"}
  *gsis_id {label: "gameid, not null"}
  start_time {label: "utctime, not null"}
  week {label: "usmallint, not null"}
  season_year {label: "usmallint, not null"}
  season_type {label: "season_phase, not null"}
  finished {label: "boolean, not null"}
  home_team {label: "varchar, not null"}
  home_score {label: "usmallint, not null"}
  away_team {label: "varchar, not null"}
  away_score {label: "usmallint, not null"}

[drive] {bgcolor: "#ececfc"}
  *+gsis_id {label: "gameid, not null"}
  *drive_id {label: "usmallint, not null"}
  start_field {label: "field_pos, null"}
  start_time {label: "game_time, not null"}
  end_field {label: "field_pos, null"}
  end_time {label: "game_time, not null"}
  pos_team {label: "varchar, not null"}
  pos_time {label: "pos_period, null"}

[play] {bgcolor: "#ececfc"}
  *+gsis_id {label: "gameid, not null"}
  *+drive_id {label: "usmallint, not null"}
  *play_id {label: "usmallint, not null"}
  time {label: "game_time, not null"}
  pos_team {label: "varchar, not null"}
  yardline {label: "field_pos, null"}
  down {label: "smallint, null"}
  yards_to_go {label: "smallint, null"}

[play_player] {bgcolor: "#ececfc"}
  *+gsis_id {label: "gameid, not null"}
  *+drive_id {label: "usmallint, not null"}
  *+play_id {label: "usmallint, not null"}
  *+player_id {label: "varchar, not null"}
  team {label: "varchar, not null"}

[meta] {bgcolor: "#fcecec"}
  version {label: "smallint, null"}
  season_type {label: "season_phase, null"}
  season_year {label: "usmallint, null"}
  week {label: "usmallint, null"}

# Relationships

player      *--1 team
game        *--1 team {label: "home"}
game        *--1 team {label: "away"}
drive       *--1 team
play        *--1 team
play_player *--1 team

game        1--* drive
game        1--* play
game        1--* play_player

drive       1--* play
drive       1--* play_player

play        1--* play_player

player      1--* play_player
このようなER図を出力することができます。
環境
$ sw_vers
ProductName:    Mac OS X
ProductVersion: 10.11.5
BuildVersion:   15F34
インストール手順
cabalで公開されていますがライブラリ(base)のバージョンが古く依存関係が解決できないのでソースコードからビルドします。
$ brew cask install haskell-platform
$ git clone git@github.com:BurntSushi/erd.git
$ cd erd
$ cabal install graphviz
$ cabal configure
$ cabal build
dist/build/erd/erdがビルドされたバイナリなので、パスが通っているディレクトリに移動します。
$ ls dist/build/erd/erd
dist/build/erd/erd
$ mv dist/build/erd/erd ~/bin/.
$ which erd
/Users/{User}/bin/erd
テキストからER図に変換
冒頭のテキストファイル(examples/nfldb.er)のサンプルをPDFに変換します。
$ erd -i examples/nfldb.er -o nfldb.pdf
PNGにも変換可能です。
$ erd -i examples/nfldb.er -o nfldb.png
