GWですね。こんな気持の良い日はなにか新しい物をウォッチングしたくなります。
ということで、題名通りSensuとGrafanaを使ってSNMPで取得したスイッチのデータを可視化してみました。
書いてある内容は 「Sensuでスイッチの通信量を取得」 とほぼ同じですが、
- ポート単位でデータを取得している
- キャッシュファイルを作ってSNMPデータの取得回数を抑えてる
- 無線LANの転送量も取得している(Ruckus限定?)
- 機器ややポートの名称も取得している
- Grafanaの表示例つき(おまけ)
あたりを追加しています。
うまく動けば下記のようにポートの数が多いスイッチでもトップ10だけを描画させるということも出来るようになります。
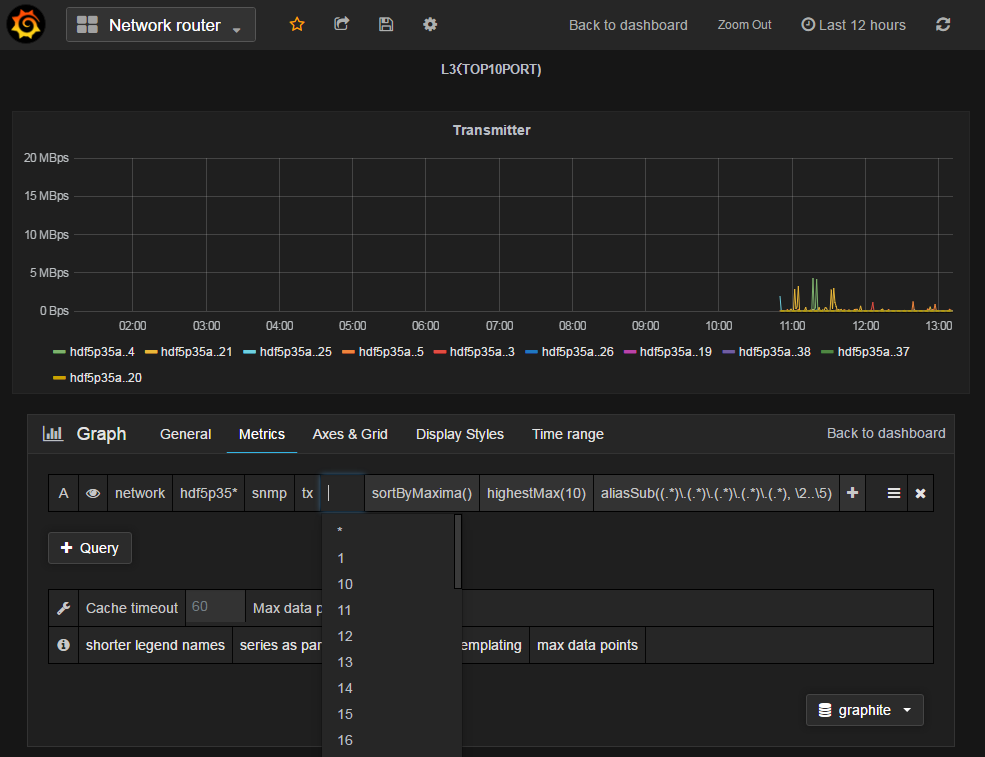
Grafanaへ追加するメトリックスは network.hdf5p35*.snmp.tx.*.sortByMaxima().highestMax(10).aliasSub((.)\.(.)\.(.)\.(.)\.(.), \2.\5) な感じで、
-
network: 接頭語(ハードコーティングされているので調整してください) -
hdf5p35*: 機器名(番号などがついていれば*で全取得) -
snmp: データ取得元 -
tx: Transmitter(受信であればrx、どちらもであれば*を指定してください) -
*: ポート(ポート名が設定されていれば名称、されていなければ番号、全部であれば*を指定してください) -
sortByMaxima: データ量が大きい順にソート -
highestMax: トップ10だけを描画 -
aliasSub: 正規表現を使って名称を指定
としています。
ちなみに、 sortByMaxima().highestMax(10) を sumSeries() にすれば元記事のように合計の値を描画させることも出来ます。
プラグインのコードは以下のとおりで、
snmp_metrics.rb
#!/usr/bin/env ruby
require "sensu-plugin/metric/cli"
require "snmp"
require "json"

class SNMPTrafficMetrics < Sensu::Plugin::Metric::CLI::Graphite
  option :hosts,
    short: "-h HOSTS",
    long: "--hosts HOSTS",
    default: "localhost,127.0.0.1"

  option :community,
    short: "-c COMMUNITY",
    long: "--community COMMUNITY",
    default: "public"

  option :sleep,
    long: "--sleep SLEEP",
    proc: proc {|a| a.to_f},
    default: 1

  option :cache,
    long: "--cache",
    default: "/tmp/snmp_cache.json"

  def oids type
    lists = {
      "wlan_rx" => "1.3.6.1.4.1.25053.1.2.2.1.1.1.1.1.14",   # for Ruckus ZoneDirector
      "wlan_tx" => "1.3.6.1.4.1.25053.1.2.2.1.1.1.1.1.16",   # for Ruckus ZoneDirector
      "lan_rx"  => "1.3.6.1.2.1.2.2.1.10",
      "lan_tx"  => "1.3.6.1.2.1.2.2.1.16",
      "name"    => "1.3.6.1.2.1.1.5.0",
      "port"    => "1.3.6.1.2.1.2.2.1.2"
    }
    lists[type]
  end

  def get_portname(manager)
    name = []
    begin
      manager.walk [oids("port")] { |vb|name << vb[0].value}
    end
    name
  end

  def get_name(manager)
    response = manager.get [oids("name")]
    name = nil
    begin
      response.each_varbind { |vb| name = vb.value }
    end
    name
  end

  def get_traffic(manager, type)
    ret = {"rx" => [], "tx" => []}
    traffic = ["rx", "tx"]
    traffic.each do |x|
      i = 1
      loop do
        oid = oids("#{type}_#{x}")
        response = manager.get ["#{oid}.#{i}"]
        begin
          response.each_varbind { |vb| ret[x][i - 1] = vb.value.to_i }
        rescue NoMethodError => e
          ret[x] = nil if i == 1
          break
        end
        i += 1
      end
    end

    ret = nil if ret["rx"] == nil or ret["tx"] == nil
    ret
  end

  def run

    json_file_path = config[:cache]
    begin
      cache = open(json_file_path) { |io| JSON.load io }
    rescue
      cache = {}
    end

    timestamp = Time.now.to_i
    threads = []

    config[:hosts].split(/,\s?/).each do |host|
      manager = SNMP::Manager.new host: host, community: config[:community]

      portname =  get_portname manager

      name = get_name manager
      threads << Thread.new do
        type = "wlan"
        traffic = get_traffic(manager, type) # wlanを試して
        if traffic == nil                    # wlanがなかったら
          type = "lan"                       # 有線ポート
          traffic = get_traffic(manager, type)
        end

        now = Time.now
        traffic_type = ["rx", "tx"]
        traffic_type.each do |x|
          traffic[x].each_index do |i|
            if cache[name]!= nil && cache[name][type] != nil
              traffic_value = traffic[x][i] - (cache[name][type]["traffic"][x][i].to_f || 0)
              time = now - Time.at(cache[name][type]["time"])
              output "network.#{name.downcase}.snmp.#{x}.#{portname[i]}", (traffic_value / time).round(2), timestamp
            else
              cache[name] = {} if cache[name] == nil
              cache[name][type] = {}
              break
            end
          end
          break if cache[name][type] == {}
        end
        cache[name][type] = {"time" => now.to_i, "traffic" => {"rx" => traffic["rx"], "tx" => traffic["tx"]}}
      end
    end

    threads.each { |thread| thread.join }

    open(json_file_path, "w") { |io| JSON.dump(cache, io) }

    ok
  end
end
設定は下記の感じで、監視したい機器のIPを指定(""で囲めば「, 」で区切ることも出来ます)すればOK。
snmp_metrics.json
{
  "checks": {
    "snmp_metrics": {
      "type": "metric",
      "handlers": ["graphite"],
      "command": "ruby /etc/sensu/plugins/snmp_metrics.rb --host \"127.0.0.1, localhost\"",
      "interval": 15,
      "subscribers": [ "sensu" ]
    }
  }
}
L3スイッチで見てみると、どのセグメントからどのセグメントへの流れが多いのか分かるようになるのでなかなかよろしい感じですね。