概要
書籍『ゼロから作るDeep Learning ―Pythonで学ぶディープラーニングの理論と実装』3章のコードを参考に Python と Ruby でステップ関数、シグモイド関数、ReLU関数のグラフを描画するプログラムを書く。
計算処理・描画処理では外部ライブラリを利用する。Python では NumPy と Matplotlib を、Ruby では Numo::NArray と Numo::Gnuplot を使用する。
環境構築が必要な場合はこちらを参照。
→ Python vs Ruby 『ゼロから作るDeep Learning』 1章 sin関数とcos関数のグラフ http://qiita.com/niwasawa/items/6d9aba43f3cdba5ca725
ステップ関数、シグモイド関数、ReLU関数のグラフを描画するコード
Python
import numpy as np
import matplotlib
matplotlib.use("AGG") # 描画ライブラリにAGG(Anti-Grain Geometry)を使う
import matplotlib.pyplot as plt

# ステップ関数
def step(x):
  return np.array(x > 0, dtype=np.int)

# シグモイド関数
def sigmoid(x):
  return 1 / (1 + np.exp(-x))

# ReLU (Rectified Linear Unit) 関数
def relu(x):
  return np.maximum(0, x)

# データの作成
x = np.arange(-5.0, 5.0, 0.1)
y1 = step(x)
y2 = sigmoid(x)
y3 = relu(x)

# グラフの描画
plt.figure(figsize=(3, 4), dpi=160) # 画像サイズ
plt.plot(x, y1, label="Step")
plt.plot(x, y2, label="Sigmoid")
plt.plot(x, y3, label="ReLU")
plt.title("Step, Sigmoid, ReLU")
plt.xlim(-5.5, 5.5) # x軸の範囲
plt.ylim(-0.2, 5.2) # y軸の範囲
plt.legend()
plt.savefig("python_graph.png")
Ruby
require 'numo/narray'
require 'numo/gnuplot'

# ステップ関数
def step(x)
  x > 0 # Numo::Bit を返す
end

# シグモイド関数
def sigmoid(x)
  1 / (1 + Numo::NMath.exp(-x)) # Numo::DFloat を返す
end

# ReLU (Rectified Linear Unit) 関数
def relu(x)
  y = Numo::DFloat[x] # コピー
  y[y < 0] = 0 # 0より小さい値の場合は0を代入する
  y
end

# データの作成
x = Numo::DFloat.new(100).seq(-5.0, 0.1)
y1 = step(x)
y2 = sigmoid(x)
y3 = relu(x)

# グラフの描画
g = Numo::gnuplot do
  set term: {png: {size: [480, 640]}} # 画像サイズ
  set output: 'ruby_graph.png'
  set title: 'Step, Sigmoid, ReLU' # タイトル
  set key: 'box left top'
  set xrange: -5.5...5.5 # x軸の範囲
  set yrange: -0.2...5.2 # y軸の範囲
  set offset: [0, 0, 0, 0]
  plot x, y1, {w: 'lines', lw: 3, title: 'Step'},
       x, y2, {w: 'lines', lw: 3, title: 'Sigmoid'},
       x, y3, {w: 'lines', lw: 3, title: 'ReLU'}
end
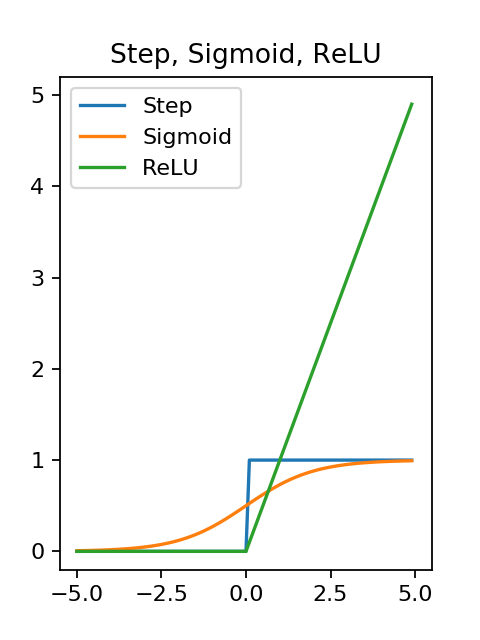
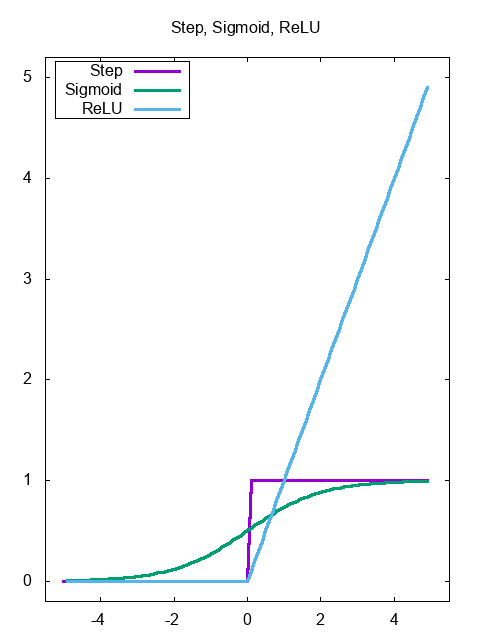
出力された画像
Python
Ruby
参考資料
- Python vs Ruby 『ゼロから作るDeep Learning』 まとめ - Qiita http://qiita.com/niwasawa/items/b8191f13d6dafbc2fede