負荷テストを簡単に作れて結果も自動でグラフ化してくれる便利ツールGatlingの紹介です
公式はここ
http://gatling.io/#/
まずはソース(scala)を自力で書いて負荷試験を作る方法
(macでの実施を前提として書いてます)
インストール方法
# download
wget https://repo1.maven.org/maven2/io/gatling/highcharts/gatling-charts-highcharts-bundle/2.1.7/gatling-charts-highcharts-bundle-2.1.7-bundle.zip

unzip gatling-charts-highcharts-bundle-2.1.7-bundle.zip
cd gatling-charts-highcharts-bundle-2.1.7-bundle
サンプルテスト実行
sh bin/gatling.sh
以下のような画面が出るので1を選択しエンター
Choose a simulation number:
     [0] computerdatabase.BasicSimulation
     [1] computerdatabase.advanced.AdvancedSimulationStep01
     [2] computerdatabase.advanced.AdvancedSimulationStep02
     [3] computerdatabase.advanced.AdvancedSimulationStep03
     [4] computerdatabase.advanced.AdvancedSimulationStep04
     [5] computerdatabase.advanced.AdvancedSimulationStep05
以下のとこは何も入力せずにエンター
Select simulation id (default is 'advancedsimulationstep01'). Accepted characters are a-z, A-Z, 0-9, - and _

Select run description (optional)
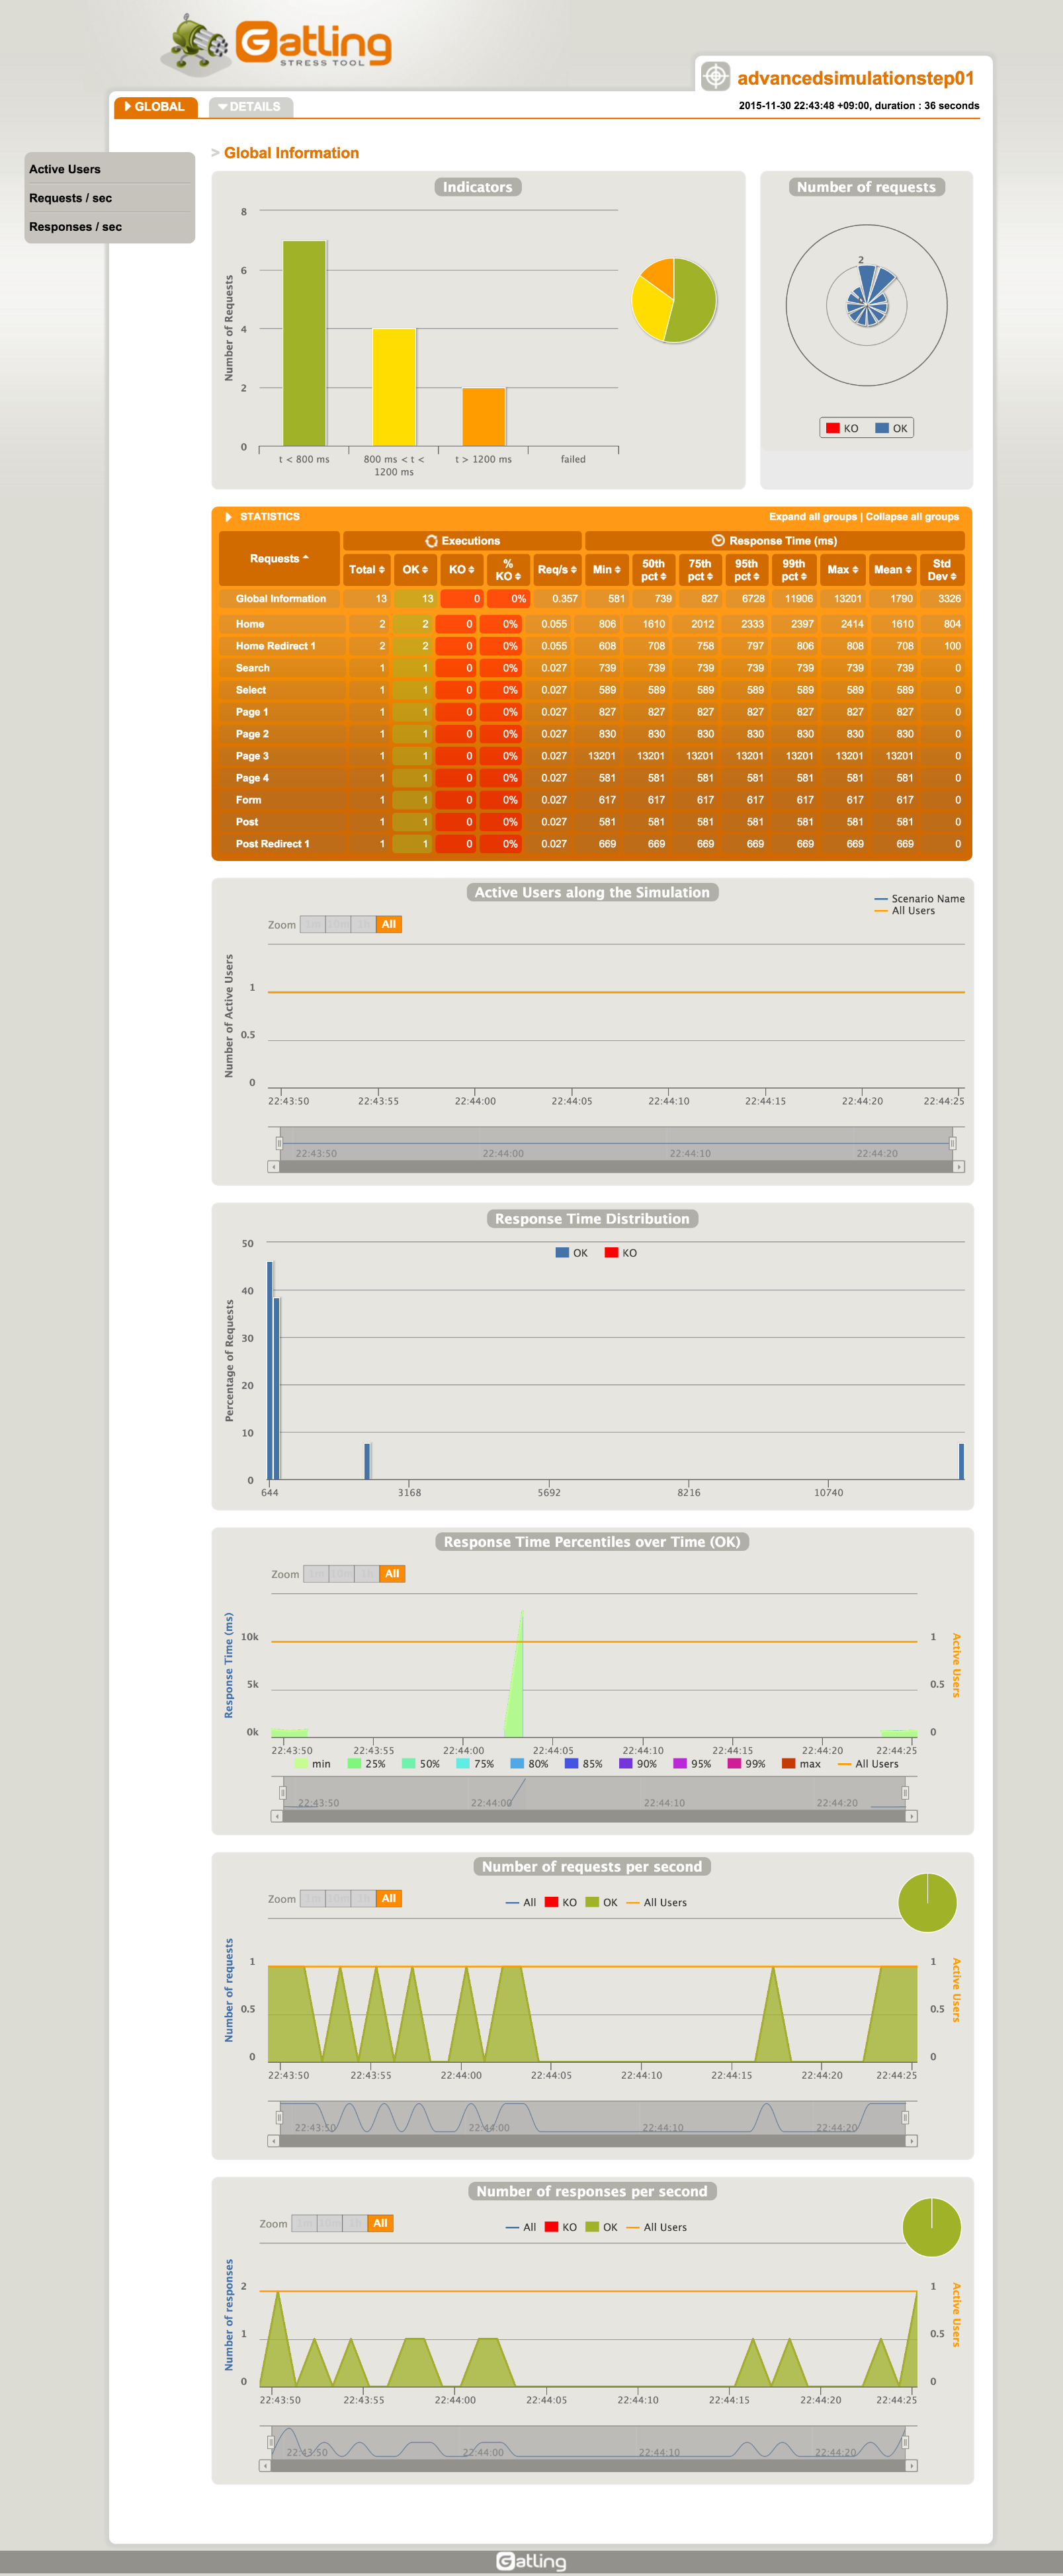
そうするとサンプルのテストが実行されて以下のような文言が出てくる
---- Response Time Distribution ------------------------------------------------
> t < 800 ms                                             7 ( 54%)
> 800 ms < t < 1200 ms                                   4 ( 31%)
> t > 1200 ms                                            2 ( 15%)
> failed                                                 0 (  0%)
================================================================================

Reports generated in 0s.
Please open the following file: results/advancedsimulationstep01-1448891028766/index.html
なので、上で出力された結果を開いてみると結果がグラフ化されている!!
(パスはテストのたびに変わる)
open results/advancedsimulationstep01-1448891028766/index.html
独自にソースを書くサンプル
[http://localhost:8080/] にgetで5秒間に10回アクセスするテスト
こんな感じでソース書く
vi user-files/simulations/computerdatabase/advanced/ApiSimulation.scala
package computerdatabase
import io.gatling.core.Predef._
import io.gatling.http.Predef._
import scala.concurrent.duration._
class ApiSimulation extends Simulation {
  val httpConf = http
    .baseURL("http://localhost:8080") // Here is the root for all relative URLs
    .acceptHeader("text/html,application/xhtml+xml,application/xml;q=0.9,*/*;q=0.8") // Here are the common headers
    .doNotTrackHeader("1")
    .acceptLanguageHeader("ja,en-US;q=0.7,en;q=0.3")
    .acceptEncodingHeader("gzip, deflate")
    .userAgentHeader("Mozilla/5.0 (Windows NT 6.1; WOW64; rv:42.0) Gecko/20100101 Firefox/42.0")

  val scn = scenario("Sample")
    .exec(http("request_1")
      .get("/"))
    .pause(100 milliseconds)

  setUp(scn.inject(rampUsers(10) over(5 seconds)) .protocols(httpConf))

}
テスト実行
作成したテストが追加されてるので、その番号を指定してエンター
bin/gatling.sh
GATLING_HOME is set to /usr/local/opt/gatling-charts-highcharts-bundle-2.1.7
Choose a simulation number:
     [0] computerdatabase.ApiSimulation
     [1] computerdatabase.BasicSimulation
     [2] computerdatabase.advanced.AdvancedSimulationStep01
     [3] computerdatabase.advanced.AdvancedSimulationStep02
     [4] computerdatabase.advanced.AdvancedSimulationStep03
     [5] computerdatabase.advanced.AdvancedSimulationStep04
     [6] computerdatabase.advanced.AdvancedSimulationStep05
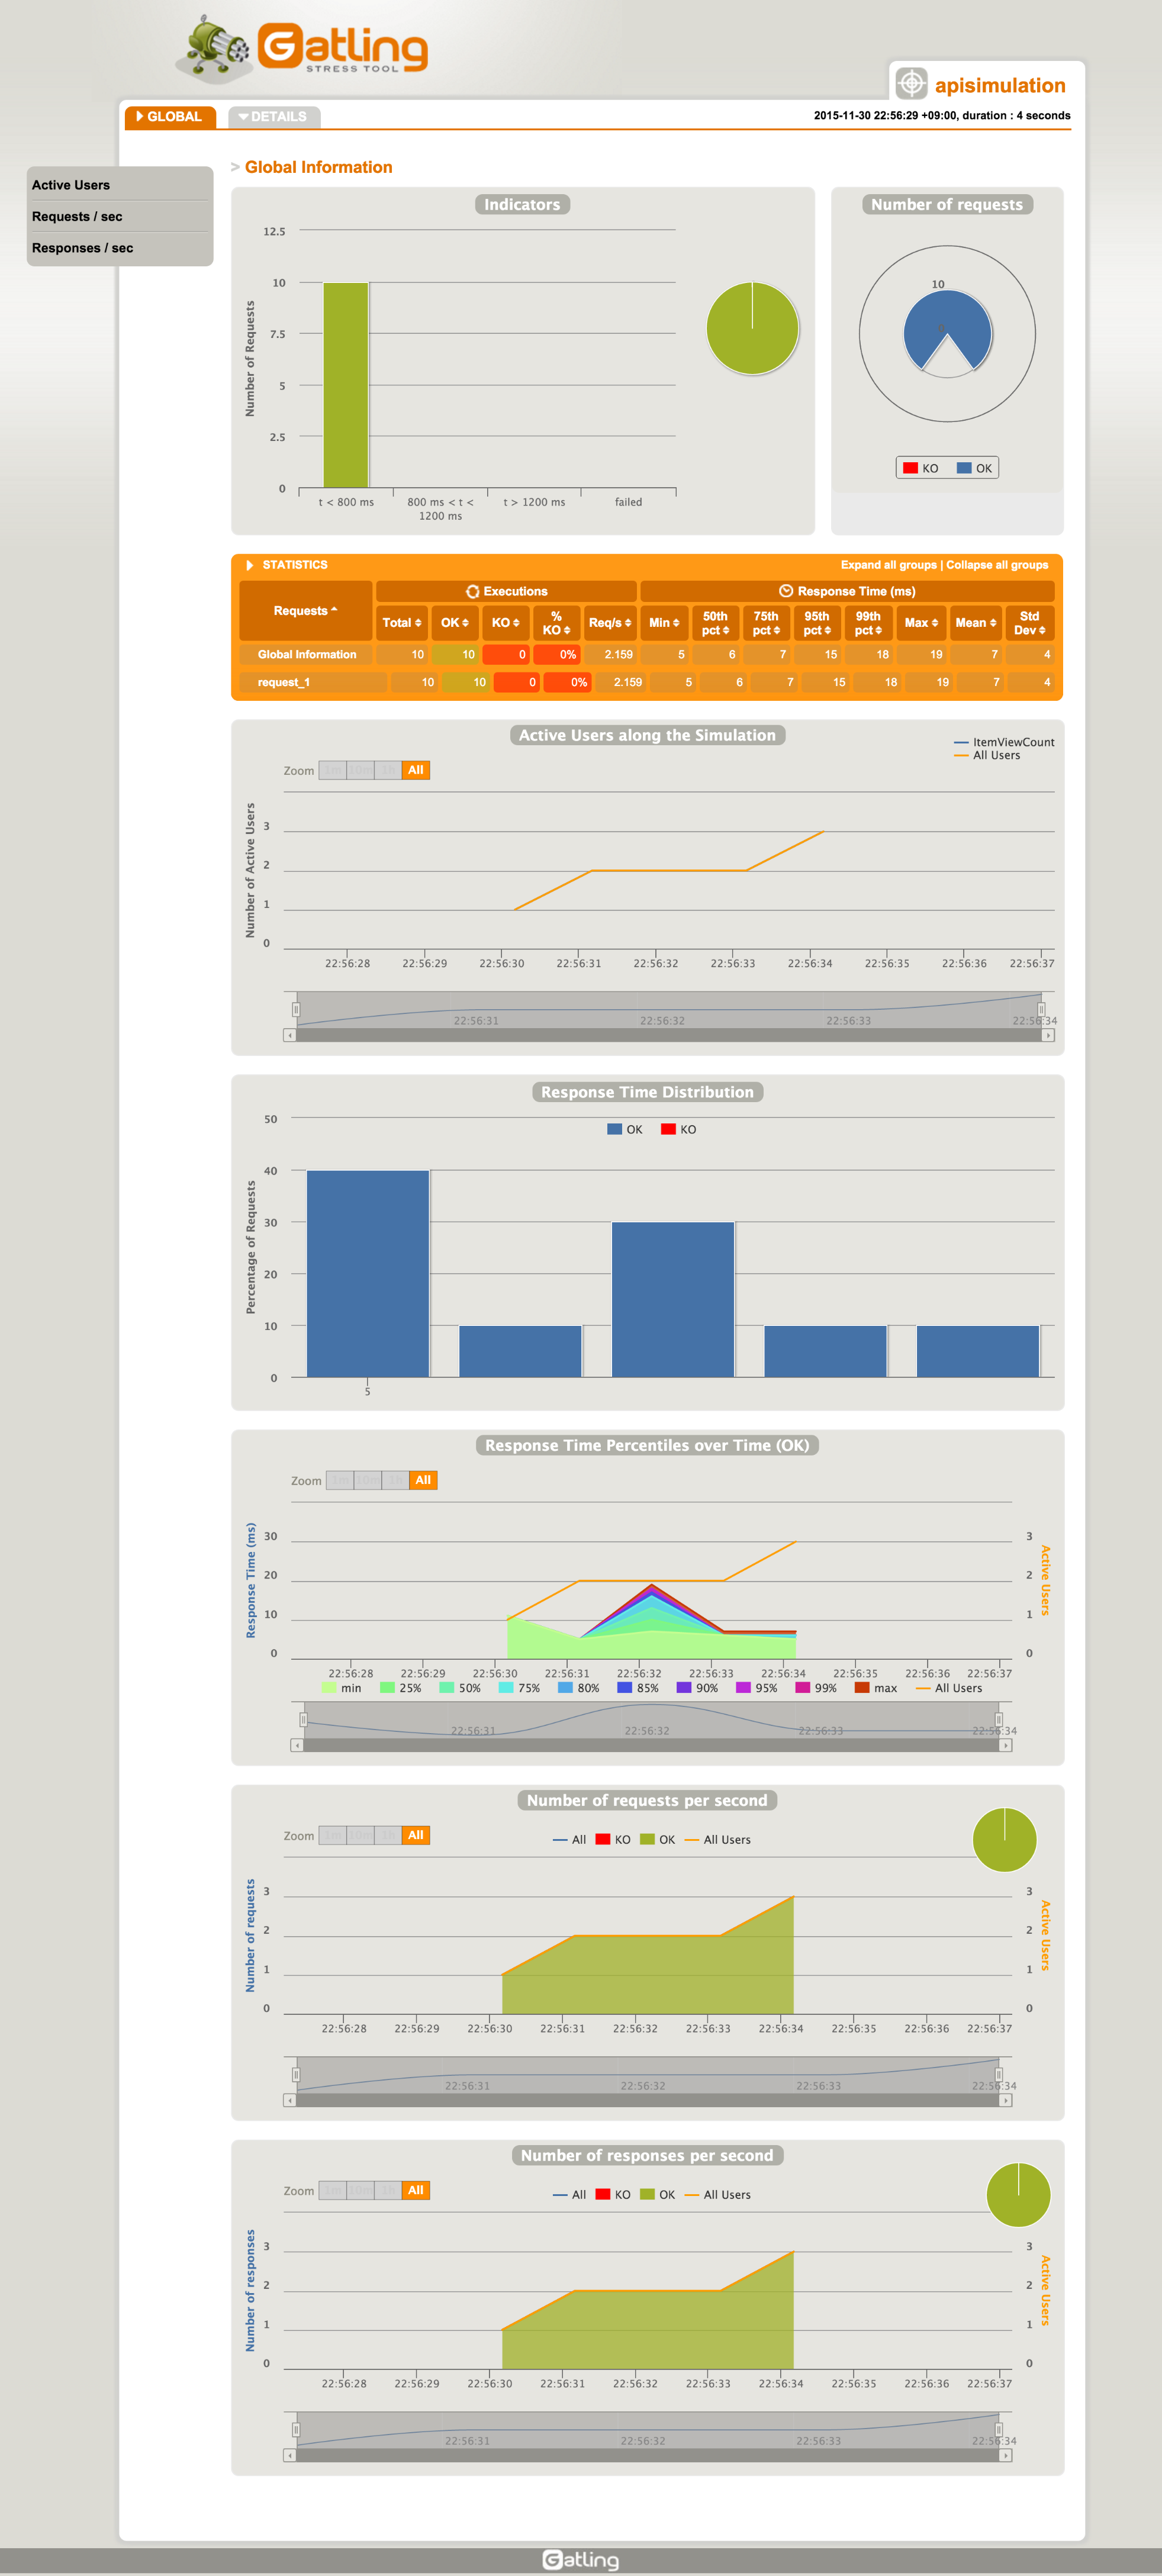
実行されて結果が作成されました!!
---- Response Time Distribution ------------------------------------------------
> t < 800 ms                                            10 (100%)
> 800 ms < t < 1200 ms                                   0 (  0%)
> t > 1200 ms                                            0 (  0%)
> failed                                                 0 (  0%)
================================================================================

Reports generated in 0s.
Please open the following file: results/apisimulation-1448891789639/index.html
結果もわかりやすくて良いですね!!
次回はブラウザで行った動作をキャプチャして自動でソースにしてくれる方法を紹介したいと思います。
続き
便利すぎる負荷試験テストツールGatlingの使い方~ブラウザ操作記憶編~
便利すぎる負荷試験テストツールGatlingの使い方~戻り値チェック編~

