jsmのインストール
$ pip install matplotlib pandas
$ pip install jsm
スクリプトの作成
取得したい企業の番号に入れ替えてください。
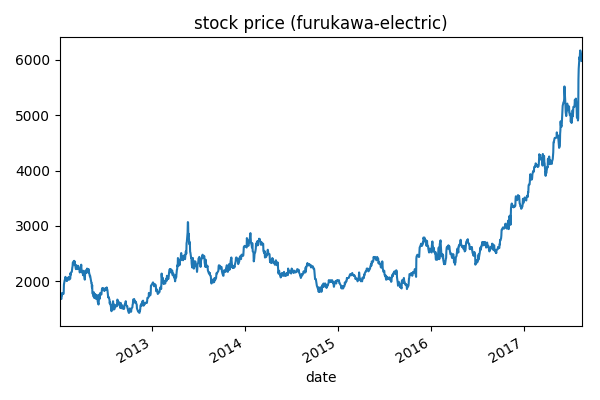
今回は私の所属企業(古河電工 5801)でやってみます。
get_stock_price.py
import datetime
import jsm

q = jsm.Quotes()

start_date = datetime.date(2012, 1, 1)
#end_date = datetime.date(2015, 12, 1)

c = jsm.QuotesCsv()
c.save_historical_prices('finance5801.csv', 5801, jsm.DAILY, start_date)
plot_stock_price.py
import matplotlib.pyplot as plt
import pandas as pd

fig = plt.figure(figsize=(6,4))
name =['date', 'open', 'high', 'low', 'close', 'volume', 'adj_close']
df = pd.read_csv('finance5801.csv', names=name, parse_dates=['date'], index_col='date')
df.head()
df['adj_close'].plot()
plt.title("stock price (furukawa-electric)")
plt.tight_layout()
plt.show()
fig.savefig("stock_furukawa.png")
実行
$ python get_stock_price.py
$ python plot_stock_price.py