scikit-learn: pythonの機械学習ライブラリ。deep learningそのものの構築はないけど、評価メトリクスやハイパーパラメータ探索に便利なAPIがあります。

インストール
$ pip install scikit-learn
1. 学習モデルの作成
- 機械学習モデルのinstance作成
- 学習(fit)、ハイパーパラメータ決定
- 予測(predict)、評価
lasso.py
from sklearn.tree import DecisionTreeClassifier
from sklearn.model_selection import GridSearchCV
from sklearn.metrics import accuracy_score

# 0. データ読み込み
from sklearn.datasets import load_iris
iris = load_iris()
X_train, X_test = iris.data[:120], iris.data[120:]
y_train, y_test = iris.target[:120], iris.target[120:]

# 1. 機械学習モデルのinstance作成
model = DecisionTreeClassifier(criterion="entropy")

# 2. 学習(fit)、ハイパーパラメータ決定
clf = GridSearchCV(model, {'max_depth': [2, 3, 4, 5, 6]}, verbose=1)
clf.fit(X_train, y_train)
print clf.best_params_, clf.best_score_

# 3. 予測(predict)、評価
pred = clf.predict(X_test)
print accuracy_score(y_true, y_pred)
2. 学習結果の評価
precision, recall, f1-score の評価
class-labelの数に偏りがあるときに有用
from sklearn.metrics import classification_report

pred = clf.predict(X_test)
print classification_report(y_test, pred)

#               precision    recall  f1-score   support
#
#           0       0.94      0.97      0.96        79
#           1       0.90      0.79      0.84        80
#           2       0.99      0.88      0.93        77
#           3       0.89      0.82      0.86        79
#           4       0.94      0.90      0.92        83
#           5       0.92      0.95      0.93        82
#           6       0.95      0.97      0.96        80
#           7       0.96      0.96      0.96        80
#           8       0.82      0.91      0.86        76
#           9       0.79      0.90      0.84        81
#
# avg / total       0.91      0.91      0.91       797
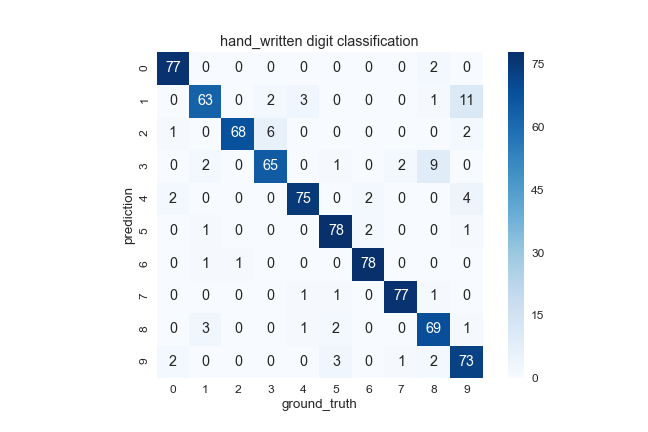
混同行列の出力
class-label種類が3以上のタスクの評価に有用
from sklearn.metrics import confusion_matrix
import pandas as pd
import seaborn as sns
import matplotlib.pyplot as plt

pred = clf.predict(X_test)
conf_mat = confusion_matrix(y_test, pred)
print conf_mat

# [[77  0  0  0  0  0  0  0  2  0]
#  [ 0 63  0  2  3  0  0  0  1 11]
#  [ 1  0 68  6  0  0  0  0  0  2]
#  [ 0  2  0 65  0  1  0  2  9  0]
#  [ 2  0  0  0 75  0  2  0  0  4]
#  [ 0  1  0  0  0 78  2  0  0  1]
#  [ 0  1  1  0  0  0 78  0  0  0]
#  [ 0  0  0  0  1  1  0 77  1  0]
#  [ 0  3  0  0  1  2  0  0 69  1]
#  [ 2  0  0  0  0  3  0  1  2 73]]


# seaborn.heatmap を使ってプロットする
index = list("0123456789")
columns = list("0123456789")
df = pd.DataFrame(conf_mat, index=index, columns=columns)

fig = plt.figure(figsize = (7,7))
sns.heatmap(df, annot=True, square=True, fmt='.0f', cmap="Blues")
plt.title('hand_written digit classification')
plt.xlabel('ground_truth')
plt.ylabel('prediction')
fig.savefig("conf_mat.png")
決定木のプロット
import pydotplus

dot_data = tree.export_graphviz(clf, out_file=None,
                         feature_names=iris.feature_names,
                         class_names=iris.target_names,
                         filled=True, rounded=True,
                         special_characters=True)

graph = pydotplus.graph_from_dot_data(dot_data)
graph.write_png('iris_tree.png')

3. その他
学習モデルの保存、読み込み
import pickle
pickle.dump(clf, open("model.pkl", "wb"))
clf = pickle.load(open("model.pkl", "rb"))

# sklearnのjoblibを使用した場合(y__samaさんのコメント参照)
from sklearn.externals import joblib
joblib.dump(clf, 'model.pkl')
clf = joblib.load('model.pkl')
サンプルデータセットの読み込み [sklearn.datasets]
from sklearn import datasets

# 3品種のアヤメのデータセット(分類)
# 150samples x 4features
iris = datasets.load_iris()

# 手書き数字のデータセット(分類)
# 1794samples x 64features
digits = datasets.load_digits()

# 地域別のボストン市の住宅価格(回帰)
# 506samples x 14features
boston = datasets.load_boston()

# 糖尿病患者の1年後の疾患進行状況(回帰)
# 442samples x 10features
diabetes = datasets.load_diabetes()

# 中国の写真。shape==(427, 640, 3)
im = datasets.load_sample_image('china.jpg')