JointJsとは
図を書くことに特化したjsライブラリです。
オープンソース・ソフトウェアですが、Rapid版という有料版が存在し、高度な実装がなされたテンプレートが使えるようになるようです。※ちなみに日本円で25万円です・・・高いw
この類のライブラリだとD3.jsが有名かと思います。
D3との違いは、純粋にjointJsの方が図を書くということに特化されているので、D3よりは簡単に書ける印象です。
ただJquery/Backbone.js/Underscore.jsに依存しているので、その辺がすこし厄介です・・・
現に僕の場合は、Underscore.jsの知識もキャッチアップする必要があったので、面倒でした。
その辺はメリットデメリットあると思うので、D3とどちらを使うかは検討して頂ければと。
APIの紹介
詳しくは公式ページを見て頂ければと思いますが、良く使うものをピックアップしてご紹介します。
joint.dia.Graph
joint.dia.Graphは、ElementやLinkを保持しておくためのJointJsの一番メインのAPIです。
var rect = new joint.shapes.basic.Rect({
    position: { x: 100, y: 100 },
    size: { width: 70, height: 30 },
    attrs: { text: { text: 'example' } }
})
var graph = new joint.dia.Graph
graph.addCell(rect)
このようにaddCellすることで、graphの中にrectを保持し、下記で説明するSVG上に描画されます。
joint.dia.Paper
joint.dia.Paperはjoint.dia.Graphを描画するためのviewを提供しているAPIです。
var graph = new joint.dia.Graph
var paper = new joint.dia.Paper({
    el: $('#paper'),
    width: 600,
    height: 400,
    gridSize: 10,
    model: graph
})
このようにelにsvgを描画するdomを、width/heightでサイズを設定します。
gridSizeは小さい方がよりpaper内での細かい動きを実現できます。
joint.shapes.basic.Rect
joint.shapes.basic.Rectはgタグで括られた要素を生成してくれます。
<g class="element basic Rect">
  <g class="rotatable">
    <g class="scalable">
      <rect />
    </g>
    <text />
  </g>
</g>
var rect = new joint.shapes.basic.Rect({
  position: { x: 100, y: 30 },
  size: { width: 100, height: 30 },
  attrs: { rect: { fill: 'blue' }, text: { text: 'my box', fill: 'white' } }
});
attrsで渡しているオプションによって下記のように様々なElementを作ることが可能です。

ちなみにextendを使ってオーバライドすることも可能です。
joint.shapes.basic.Rect = joint.shapes.basic.Generic.extend({
  markup: '<g class="rotatable"><g class="scalable"><rect/></g><text/></g>',
  defaults: joint.util.deepSupplement({
    type: 'basic.Rect',
    attrs: {
      'rect': {
        fill: 'white',
        stroke: 'black',
        'follow-scale': true,
        width: 80,
        height: 40
      }
    }
  }, joint.shapes.basic.Generic.prototype.defaults)
});
例えばこのようにmarkupにデフォルトで出力したい構成を作り、attrsでデフォルト値を設定しておけばnewするだけでこの形になります。
joint.dia.Link
joint.dia.Linkは上記のようなエレメントを繋ぎ合わせる線を描画してくれるAPIです。
var link = new joint.dia.Link({
  source: { id: rect.id },
  target: { id: rect2.id }
});
このようにsourceとtargetにelementのidを渡してあげると、それらを繋ぎあわせてくれます。
こちらもオプションの設定次第で多くの種類のlineを実装できます。
例えば右上の何回か折り返しているような線を実装したい場合は、
var link = new joint.dia.Link({
  source: { id: rect.id },
  target: { id: rect2.id },
  vertices: [{ x: 100, y: 120 }, { x: 150, y: 60 }
});
verticesに座標入れてあげると折り返してくれます。
Eventに関して
var rect = new joint.shapes.basic.Rect({
    position: { x: 100, y: 100 },
    size: { width: 70, height: 30 },
    attrs: { text: { text: 'example' } }
})

rect.on('change:position', function(element) {
    console.log(element.id, ':', element.get('position'));
});
このように書くことが出来ます。簡単ですね。
Element/Paper/Graphとそれぞれハンドリングできるイベントが異なります。
よく使うものだけ解説します。
Element
- change:エレメントに何かしらの変更が生じた場合
- change:position:positonに変更があった場合
- change:angle:エレメントが回転した場合
- change:size:エレメントのサイズに変化が合った場合
- change:attrs:エレメントのattributesに変更が合った場合
Paper
- cell:pointerdown:addCellしたElementに対してpointerを下ろした場合
※同じようなものでpointerup/pointermoveが存在しています - cell:mouseover:addCellしたElement上をmouseoverした場合
paper.on('blank:pointerdown', function(evt, x, y) {
  alert('pointerdown');
})
Graph
- change:何かしらgraphに変更があった場合
- add:graphにaddした場合
- remove:graphからremoveした場合
graph.on('add', function(cell) {
  alert(cell.id + 'がaddされました');
})
サンプルの解説
実行結果はこちら
※表示されてませんね・・・orz
<!DOCTYPE html>
<html>
<meta http-equiv="Content-Type" content="text/html; charset=UTF-8">
<head>
    <link rel="stylesheet" href="stylesheets/joint.min.css" />
    <link rel="stylesheet" href="stylesheets/main.css" />
    <script src="javascripts/jquery.min.js"></script>
    <script src="javascripts/lodash.min.js"></script>
    <script src="javascripts/backbone-min.js"></script>
    <script src="javascripts/joint.min.js"></script>
    <script src="javascripts/main.js"></script>
</head>
<body>
  <div id="paper"></div>
</body>
</html>
$(function() {
  graph = new joint.dia.Graph;
  paper = new joint.dia.Paper({
   el: $('#paper'),
  width: 800,
   height: 800,
   gridSize: 100,
   model: graph
  });

  // 初期から出ているbox
  var el1 = new joint.shapes.html.Element({
    position: { x: 80, y: 80 },
    size: { width: 170, height: 80 },
    divName: 'Atrae',
    isCompany: true
  });

  graph.addCells([el1]);

  paper.on('cell:pointerup', function(cellView, evt, x, y) {
    var elementBelow = graph.get('cells').find(function(cell) {
      if (cell instanceof joint.dia.Link) return false;
      if (cell.id === cellView.model.id) return false;
      if (cell.getBBox().containsPoint(g.point(x, y))) return true;
      return false;
    });

    if (elementBelow && !_.contains(graph.getNeighbors(elementBelow), cellView.model)) {
      graph.addCell(new joint.shapes.org.Arrow({
        source: { id: cellView.model.id },
        target: { id: elementBelow.id }
      }));
      cellView.model.translate(-200, 0);
    }
  });
});

joint.shapes.html = {};
joint.shapes.html.Element = joint.shapes.basic.Rect.extend({
  defaults: joint.util.deepSupplement({
    type: 'html.Element',
    attrs: {
      rect: { stroke: 'none', 'fill-opacity': 0 }
    }
  }, joint.shapes.basic.Rect.prototype.defaults)
});

joint.shapes.html.ElementView = joint.dia.ElementView.extend({
  template: [
    '<div class="html-element">',
    '<button class="delete">x</button>',
    '<input type="text" value=""/>',
    '<button class="js-divName"></button>',
    '<button class="add">+</button>',
    '</div>'
  ].join(''),

  initialize: function() {
    _.bindAll(this, 'updateBox');
    joint.dia.ElementView.prototype.initialize.apply(this, arguments);

    this.$box = $(_.template(this.template)());
    this.$box.find('input').on('mousedown click', function(evt) { evt.stopPropagation(); });

    this.$box.find('input').on('change', _.bind(function(evt) {
      this.model.set('divName', $(evt.target).val());
    }, this));

    // delete element
    this.$box.find('.delete').on('click', _.bind(this.model.remove, this.model));
    this.$box.find('.add').on('click', _.bind(this.addBox, this.model));
    this.model.on('change', this.updateBox, this);
    this.model.on('remove', this.removeBox, this);

    if (this.model.get('isCompany') === true) {
      this.$box.find('input').remove();
      this.$box.find('.delete').remove();
    }
    this.updateBox();
  },
  render: function() {
    joint.dia.ElementView.prototype.render.apply(this, arguments);
    this.paper.$el.prepend(this.$box);
    this.updateBox();
    return this;
  },

 updateBox: function() {
    var bbox = this.model.getBBox();
    this.$box.find('.js-divName').text(this.model.get('divName'));
    this.$box.css({
      width: bbox.width,
      height: bbox.height,
      left: bbox.x,
      top: bbox.y,
      transform: 'rotate(' + (this.model.get('angle') || 0) + 'deg)'
    });
  },
  removeBox: function(evt) {
    this.$box.remove();
  },
  addBox: function(evt) {
    var el1 = new joint.shapes.html.Element({
      position: { x: evt.clientX + 120, y: evt.clientY - 35 },
      size: { width: 170, height: 80 },
      divName: ''
    });

    var line = new joint.shapes.org.Arrow({
      source: { id: this.id },
      target: { id: el1.id },
      vertices: [{ x: 100, y: 120 }, { x: 150, y: 60 }]
    });
    graph.addCells([el1, line]);
  }
});
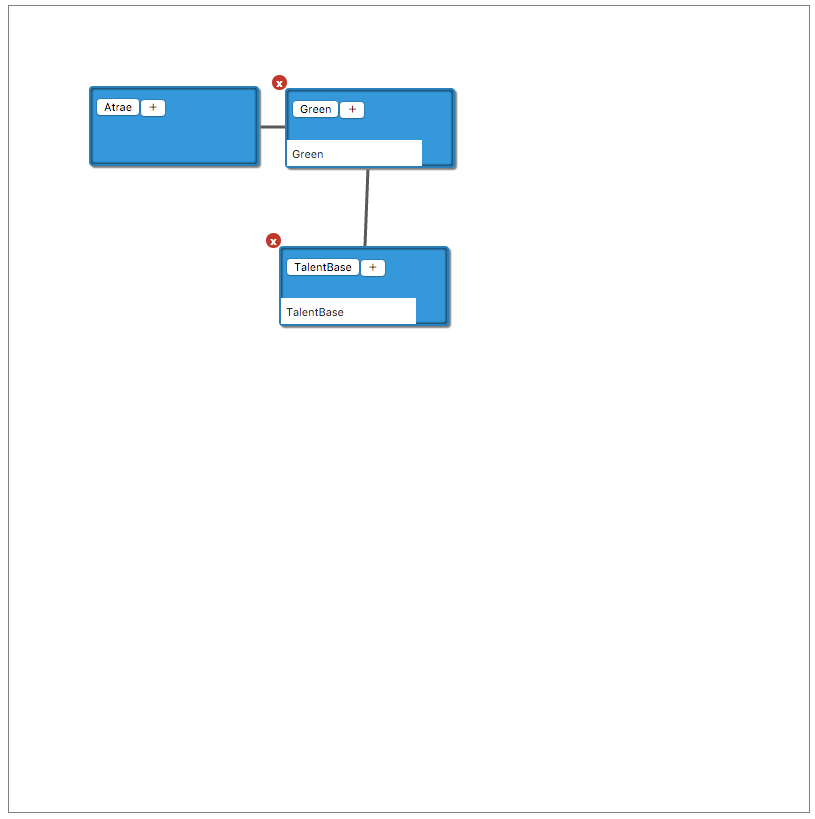
一応以下のようなものが出来ましたw

