はじめに
最近良くJupyter notebook(Python3)のお世話になっていて、
いくつか小技が増えたので投稿します。
環境
- Jupyter Notebook 4.2.x
- Python 3.5.x
※ 例えば、https://github.com/mokemokechicken/jupyter-tensorflow のDocker上のJupyter環境で使えます。
小技たち
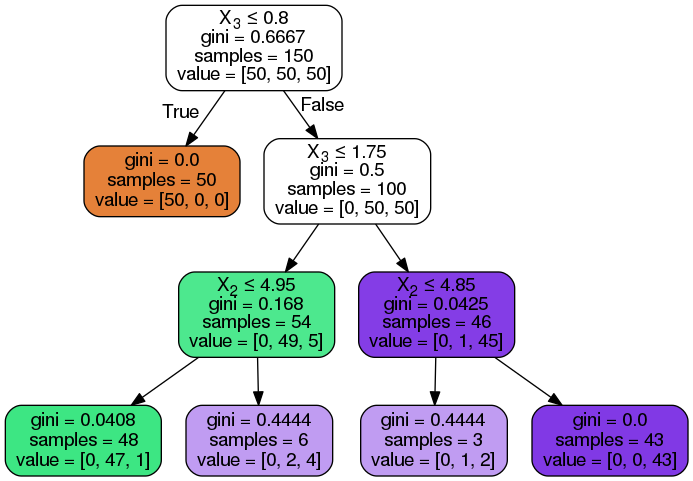
sklearnの決定木の結果を図に変換してinlineで表示する
sklearn.tree.tree.DecisionTreeClassifier などの決定木のは .dot形式出力はできるものの、それを notebook上に表示しようとすると結構厄介です。
しかし、一定の準備と手続きをすればその辺を簡単にできるようになります。
必要なもの
- OS上にgraphvizをインストールしておいて
dotに環境変数PATHが通っている状態
方法
こんな関数を定義します。
decision_tree_util.py
import os
from tempfile import mkstemp
import subprocess

from sklearn.tree.export import export_graphviz


def convert_decision_tree_to_ipython_image(clf, feature_names=None, class_names=None,
                                           image_filename=None, tmp_dir=None):
    dot_filename = mkstemp(suffix='.dot', dir=tmp_dir)[1]
    with open(dot_filename, "w") as out_file:
        export_graphviz(clf, out_file=out_file,
                        feature_names=feature_names,
                        class_names=class_names,
                        filled=True, rounded=True,
                        special_characters=True)

    from IPython.display import Image

    image_filename = image_filename or ('%s.png' % dot_filename)

    subprocess.call(('dot -Tpng -o %s %s' % (image_filename, dot_filename)).split(' '))
    image = Image(filename=image_filename)
    os.remove(dot_filename)
    return image
こんな感じで使えます。
notebook
from sklearn import datasets
from sklearn.tree.tree import DecisionTreeClassifier
%matplotlib inline

iris = datasets.load_iris()
X = iris.data
Y = iris.target

clf = DecisionTreeClassifier(max_depth=3)
clf.fit(X, Y)
convert_decision_tree_to_ipython_image(clf, image_filename='tree.png')
実行時にimport したファイルの再読み込みをする
別の場所からimportしているファイルを変更したので再読み込みしたいときがあると思います。
以下のように書いておくと、 notebook を実行するたびに再読み込みするようになります。
これを知る前は毎回kernelのリスタートしてました (^^;
%reload_ext autoreload
%autoreload 2
プログラム中からグラフやpandas.DataFrameなどを notebook上に複数個出力する
DataFrame などを出力したい
from IPython.core.display import display
を importしておいて、
display(data_frame)
とすればいつものように表示されます。文字列などを渡せば普通に文字列が出力されます。
グラフを出力したい
こう書いてしまうと、
notebook
from IPython.core.display import display
from numpy.random.mtrand import normal
import matplotlib.pyplot as plt
import seaborn as sns
%matplotlib inline
display('graph1')
sns.distplot(normal(0, 1, size=1000))
sns.distplot(normal(0.1, 2, size=1000))
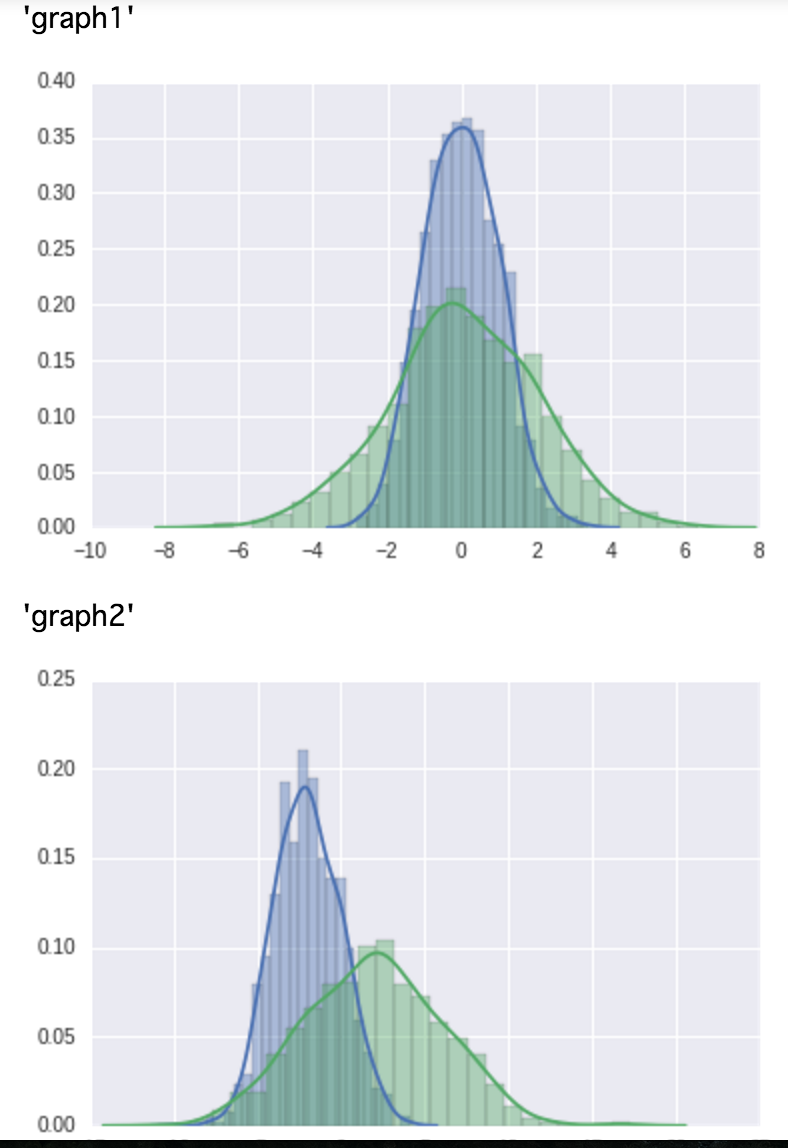
display('graph2')
sns.distplot(normal(-2, 2, size=1000))
sns.distplot(normal(2, 4, size=1000))
グラフが一つに固まるし、一番下にグラフが来てしまいます。

そういうときは plt.show() を適切なタイミングで呼ぶと良いです。
notebook
from IPython.core.display import display
from numpy.random.mtrand import normal
import matplotlib.pyplot as plt
import seaborn as sns
%matplotlib inline

display('graph1')
sns.distplot(normal(0, 1, size=1000))
sns.distplot(normal(0.1, 2, size=1000))
plt.show()

display('graph1')
sns.distplot(normal(-2, 2, size=1000))
sns.distplot(normal(2, 4, size=1000))
plt.show()
これは notebook上の scriptだけでなく、 普通のソースコードから notebookに出力をしたいときにも使えます。
さいごに
小技でした。